Most traders still bullish…
But charts?
Saying something else.
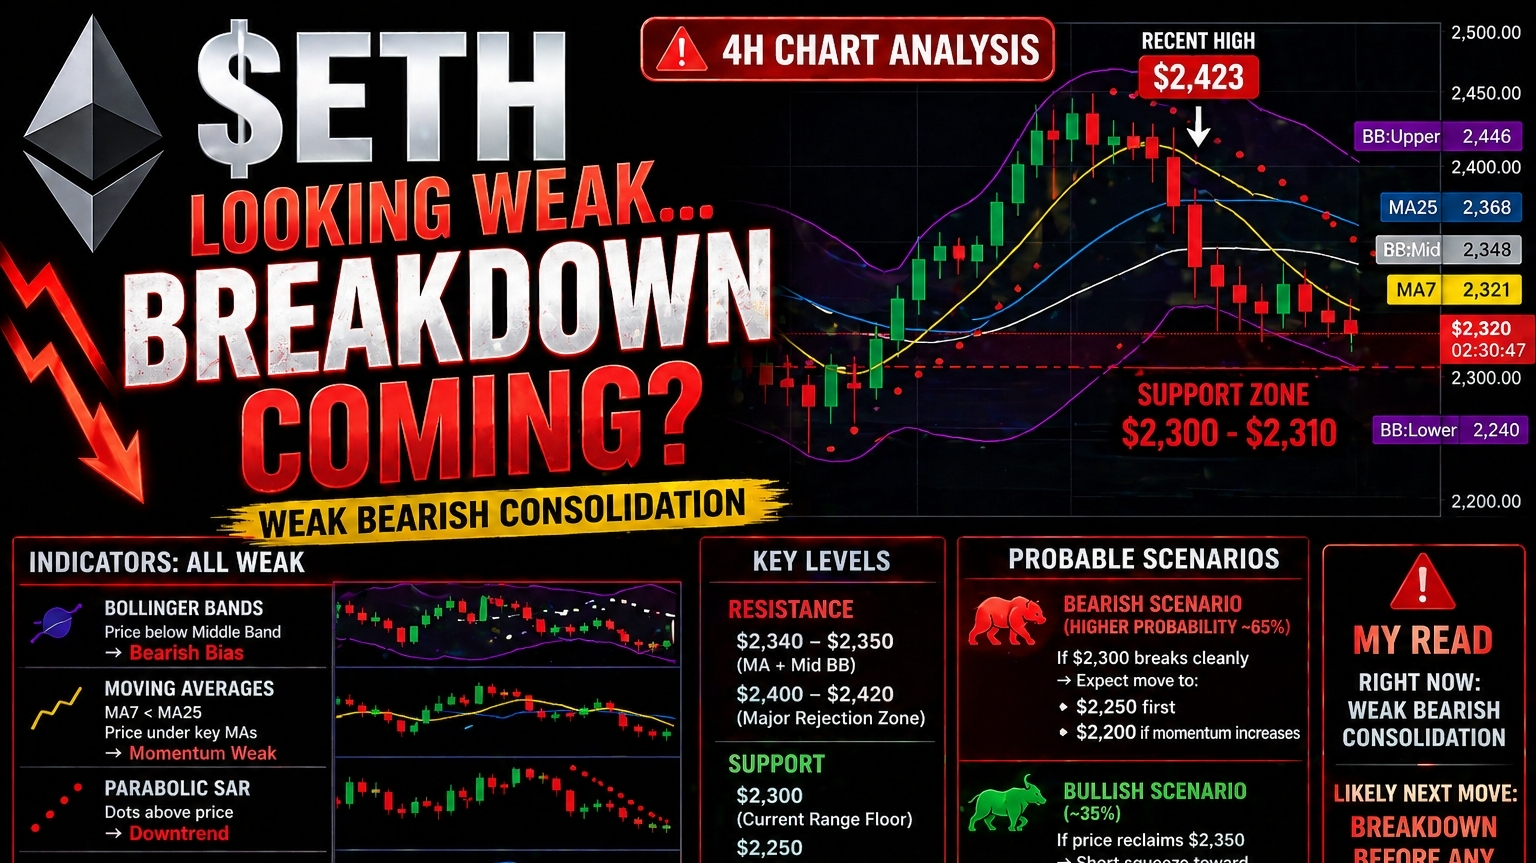
📉 Rejected hard from $2,420
📊 Now consolidating near $2,300
⚠️ Signals Right Now:
👉 Price below key MAs
👉 RSI / momentum weak
👉 SAR bearish
👉 MACD turning red
No strength. No momentum.
💀 Structure?
Lower highs forming…
This looks like distribution.
📊 Key Level
📍 $2,300 = make or break
Break this…
👉 $2,250 next
👉 $2,200 possible fast
🧠 Only bullish if:
👉 Reclaim $2,350 with volume
Otherwise?
More downside first.
🔥 My take:
Not a pump zone.
This looks like a setup for breakdown.
👇 Comment “BEARISH” or “BOUNCE”
👉 Follow for real setups (no hype)

ETHUSDT
Trajne ter. pog.
2,310.43
-0.57%