# Bitcoin's Next Move: Is $70K a Bull Trap Before a Drop to $50K?
## Introduction
Bitcoin (BTC) is once again at a critical juncture. After spending weeks trading in a tight range between roughly $62,500 and $67,000, a growing number of chart-watchers are warning that any rally toward the $70,000 level could turn out to be a trap rather than a breakout — one that ultimately sends price sliding back toward $50,000. This article breaks down that scenario, the reasoning behind it, and how traders using platforms like Binance can think about risk if this path plays out.
---
## The Current Setup
As of early August 2026, BTC has been trading in the $64,000–$64,500 zone, holding above a key support level near $62,500 after bouncing off it multiple times. On the upside, $67,000–$70,000 has repeatedly acted as resistance — price has approached that ceiling several times without a decisive breakout.
This kind of range-bound, "coiled spring" price action is exactly the environment where bull traps tend to form: a sharp move above resistance draws in momentum buyers, only for the move to reverse hard once early participants start taking profit.
---
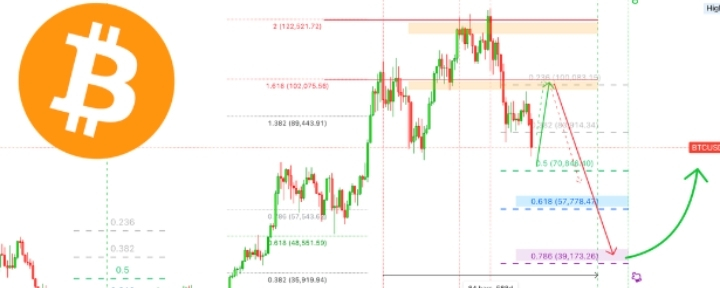
## The Bear Case: $64K → $70K → $57K → $50K
One widely shared projection maps out a specific path for Bitcoin:
- **$64K** — current consolidation zone
- **$70K** — a final push higher that lures in late buyers (the "bull trap")
- **$57K** — a sharp reversal breaking back below prior support
- **$50K** — the eventual downside target
The logic behind this call rests on a few common technical and psychological patterns:
1. **Liquidity hunting** — Exchanges and market makers often see large clusters of buy-side liquidity (stop-losses and leveraged longs) sitting just above resistance levels like $70K. A brief spike through that level can trigger cascading buy orders, giving large sellers a chance to exit into strength.
2. **Exhaustion after a failed breakout** — If $70K is reached on declining volume or momentum, that's typically read as a warning sign rather than confirmation of strength.
3. **Round-number psychology** — $50,000 is a major psychological level, and markets often gravitate toward such round numbers once a downtrend gains momentum.
4. **"Exit liquidity" warning** — The core message behind this kind of call is that retail buyers chasing a breakout above $70K risk becoming the liquidity that larger holders sell into, rather than participants in a genuine trend continuation.
---
## Important Context: This Is a Prediction, Not a Certainty
It's worth being clear-eyed about what this kind of chart call actually is: one trader's or analyst's interpretation of price structure, not a guaranteed outcome. Bitcoin has defied similarly confident bearish (and bullish) calls many times before. A few things worth weighing:
- **Macro drivers matter as much as chart patterns.** US jobs data, Federal Reserve rate decisions, and regulatory developments (such as pending crypto legislation) have been moving BTC in the short term, and any of these can override a purely technical setup.
- **A breakout above $70K could just as easily be genuine.** Strong volume, sustained follow-through, and supportive macro news could turn a "trap" narrative into a real trend change.
- **Bull-trap calls are common in every cycle.** They're worth taking seriously as one scenario among several, not as the default outcome.
---
## How Traders Might Approach This on Binance
If you're managing BTC exposure on Binance while this scenario plays out, a few standard risk-management practices apply regardless of which direction the market goes:
- **Use stop-losses** below key support levels (e.g., near $62,500) to limit downside if the bearish scenario begins to play out.
- **Watch volume on any breakout.** A move above $70K on strong, sustained volume looks very different from a thin, low-volume spike that quickly fades.
- **Avoid over-leveraging into a breakout.** Bull traps disproportionately punish leveraged long positions opened right at resistance.
- **Track macro catalysts** — Non-Farm Payrolls, CPI prints, and Fed commentary — since these often determine whether a technical level holds or breaks.
- **Scale in/out rather than going all-in at one price**, which reduces the impact of being wrong about the exact top or bottom.
---
## Conclusion
The $64K → $70K → $57K → $50K scenario is a compelling technical narrative, and the underlying warning — "don't become the exit liquidity" — is a useful reminder for anyone chasing a breakout without a plan. But it remains one possible path among several. Bitcoin could just as easily break decisively above $70K and continue higher if macro conditions turn supportive. The safest approach is not to bet everything on a single predicted path, but to have a risk plan — clear invalidation levels, sensible position sizing, and stop-losses — that works whether the breakout is real or a trap.
####HYPEGains79%InQ2 #Bitcoin #BTC #Crypto #Cryptocurrency #BitcoinPriceUpdate #CryptoTrading #BTCUSDT #Binance #BullTrap #BitcoinAnalysis #TechnicalAnalysis #CryptoMarket #BitcoinCrash #CryptoTrader #DYOR #CryptoWarning #BitcoinPrediction #ExitLiquidity #CryptoUpdate