
BTC/USD · 1H Chart · Market Structure & Fair Value Gap Analysis
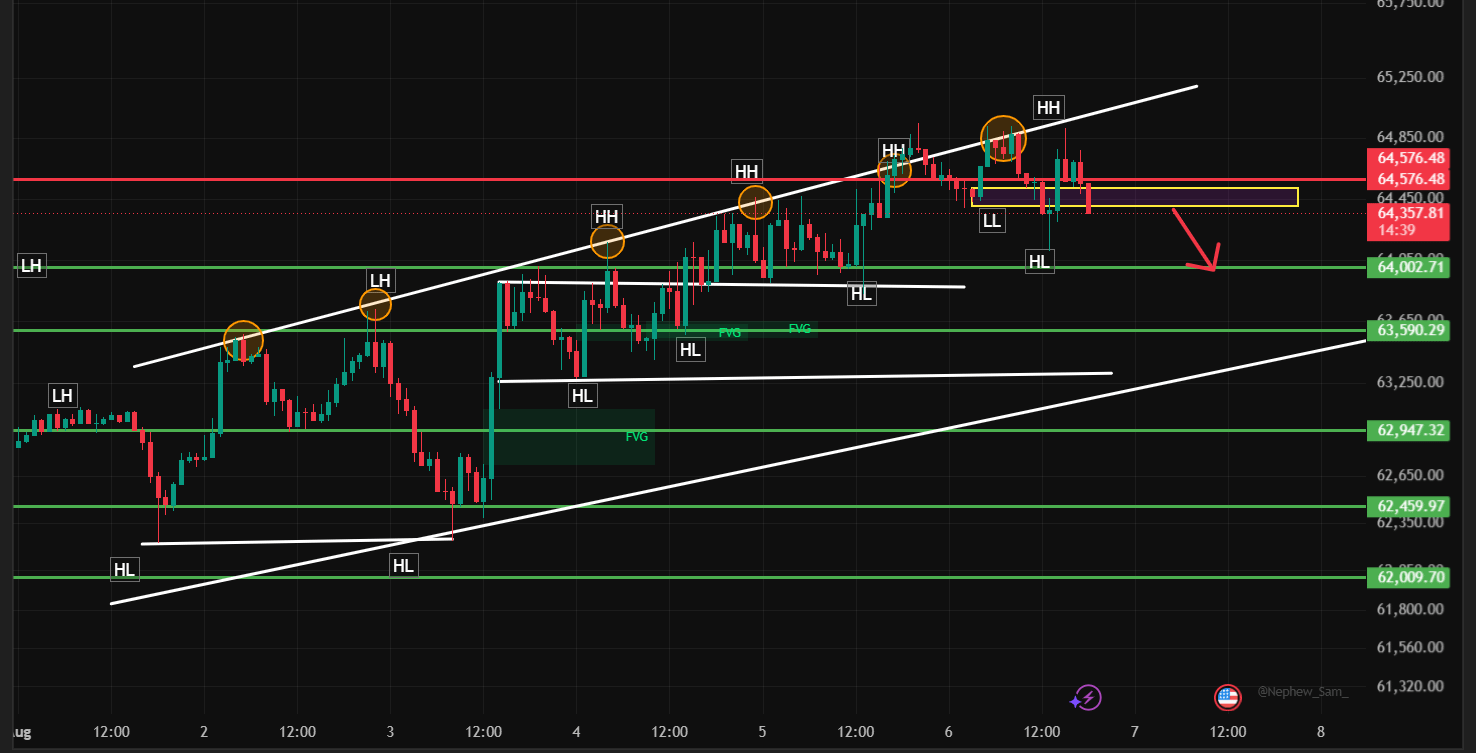
Bitcoin has spent the last week grinding out a textbook uptrend — a clean staircase of Higher Highs (HH) and Higher Lows (HL) that carried price from the low-$62,000s up toward the $64,800–65,000 zone. But the most recent leg of that move is starting to show cracks, and traders watching the 1H chart need to pay close attention to what happens next around the $64,000–64,600 range.
The Structure So Far
Since the start of the month, BTC has respected a rising trendline almost perfectly, printing a sequence of pivots that any structure-based trader would recognize instantly:
A base built around $62,000–62,460, followed by a series of Higher Lows.
A steady climb through $62,947 and $63,590, each acting as a springboard for the next leg up.
Repeated Higher Highs stacking into the $64,800–65,000 region, right into a second, steeper trendline.
That's healthy, disciplined trend behavior — until the most recent swing. After tagging a fresh high near $64,850, price failed to hold its prior Higher Low and instead printed a Lower Low (LL), the first break in the HH/HL sequence in this entire move. Since then, BTC has been consolidating tightly just beneath a horizontal resistance shelf at $64,576, unable to reclaim the highs.
That combination — a broken HL and rejection at resistance — is exactly the kind of early warning sign that a trend is losing momentum, even if the broader structure hasn't flipped bearish yet.
Key Levels to Watch
Resistance:
$64,576 — immediate resistance, the ceiling of the current consolidation range.
$64,850–65,000 — the prior swing high and rising trendline; a close above this zone would invalidate the short-term bearish signal entirely.
Support:
$64,002 — first line of defense; this is the level the current range is built on.
$63,590 — sits inside an unfilled Fair Value Gap (FVG) from earlier in the move; a natural magnet if $64,002 breaks.
$62,947 — deeper support and the last major HL before the FVG zone near $62,700–63,000.
The unfilled FVGs beneath current price are worth noting specifically — price has a habit of returning to fill these gaps before any sustainable continuation, which is part of why the $63,590–63,900 zone stands out as a likely draw on liquidity if the $64,002 support gives way.
Two Ways to Play This
Scenario A — Fade the resistance (favors the current LL/BOS signal):
Entry: On rejection from the $64,450–64,576 zone
Stop-loss: Above $64,850 (invalidates the bearish structure)
Target 1: $64,002
Target 2: $63,590 (FVG fill)
Target 3: $62,947
Scenario B — Buy the dip if support holds:
Entry: Confirmation of a bounce/HL forming in the $64,000–64,050 zone
Stop-loss: Below $63,590
Target 1: $64,576
Target 2: $64,850
Scenario C — Bullish reclaim (trend resumption):
Entry: On a confirmed close above $64,850
Stop-loss: Below $64,450
Target 1: $65,250
Target 2: Prior structural high near $65,750
Bottom Line
The broader trend on BTC/USD is still technically intact, but the recent Lower Low is the first real dent in an otherwise clean uptrend, and price is now sitting at a genuine decision point beneath $64,600 resistance. A clean reclaim of $64,850 would put the bulls firmly back in control; a breakdown below $64,002 opens the door toward the $63,590 FVG and potentially $62,947.
Watch this zone closely over the next few sessions — it's likely to define whether this is a healthy pause in an uptrend or the start of a deeper correction.
This article is for informational and educational purposes only and does not constitute financial advice. Cryptocurrency trading involves substantial risk of loss. Always do your own research and manage risk according to your own financial situation before making any trading decisions.
@Binance Square Official @Bitcoin #USInitialJoblessClaimsStayBelow200K #ColdcardExploitFundsSentToMixers #JapanRegulatorsUrgeCryptoWithdrawalLimits #binance #chartsniper