

Bitcoin traded at $115,975 on Sept. 13, 2025, with a market capitalization of $2.31 trillion and a 24-hour trading volume of $43.07 billion. The cryptocurrency’s intraday price fluctuated between $114,838 and $116,705 as it continued to consolidate recent gains.
BITCOIN
Bitcoin held steady near its upper range as it consolidated gains from its recent upward breakout, showing signs of a maturing rally with cautious but firm momentum. The current trend across multiple timeframes reveals a bullish bias, though some oscillators hint at overextension and potential short-term exhaustion.
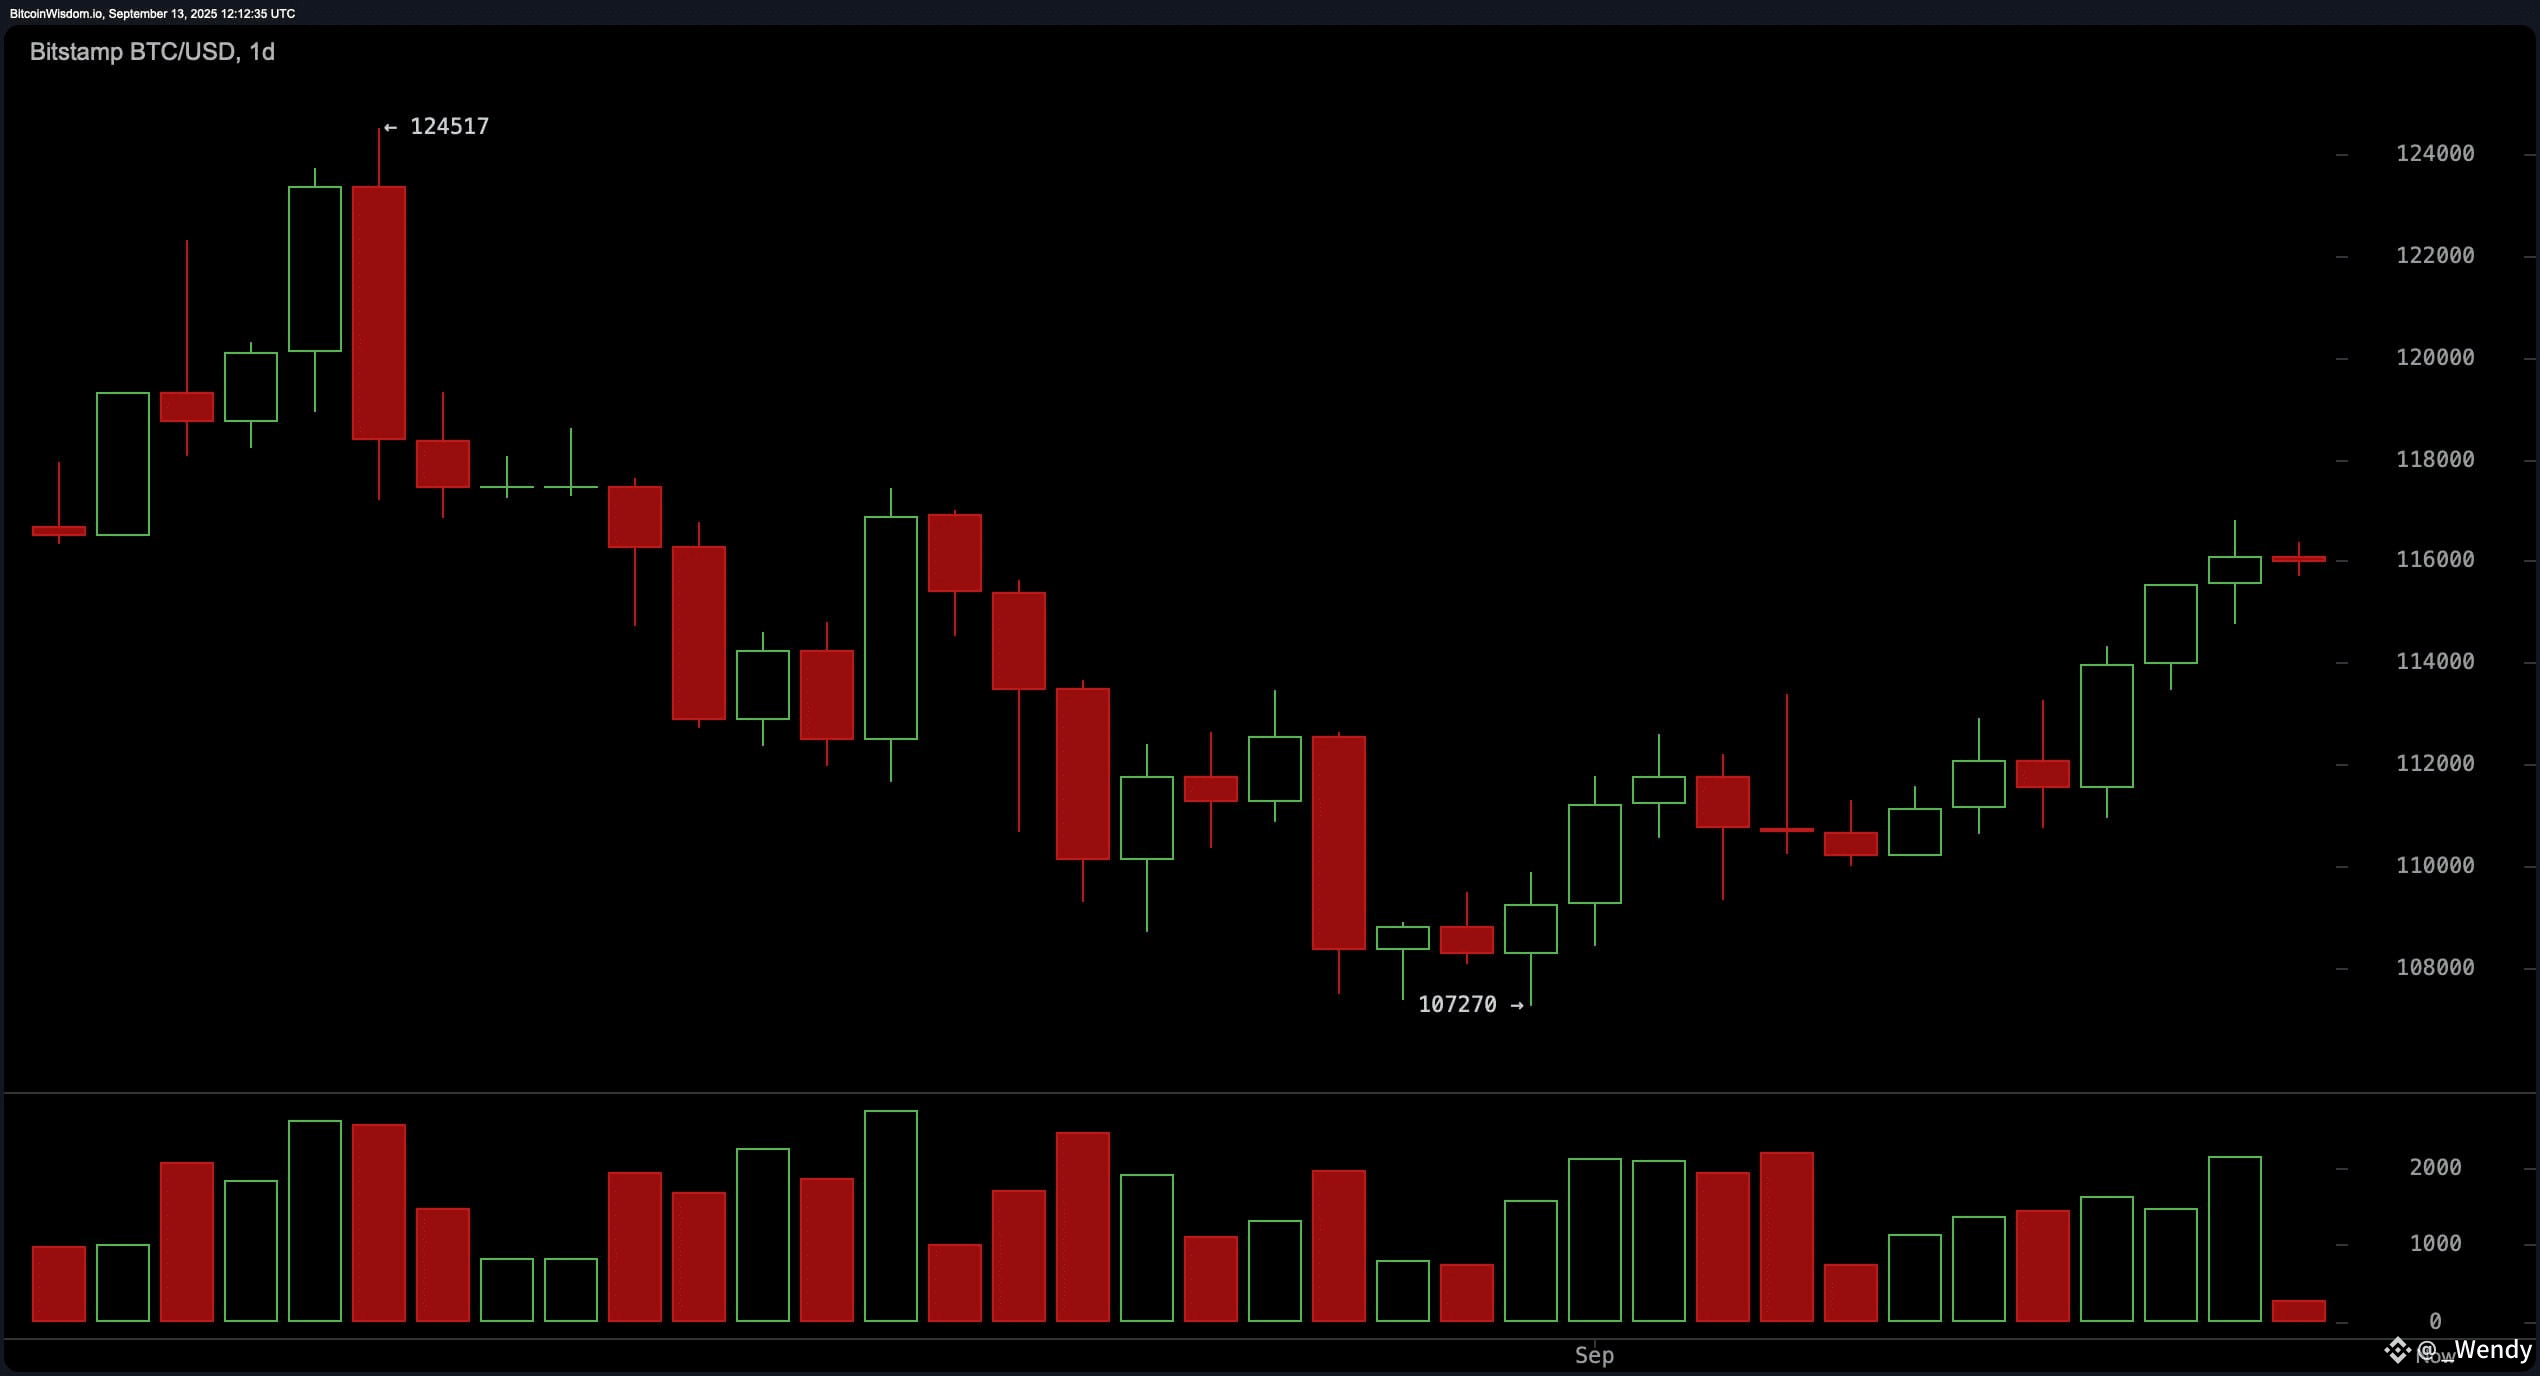
On the daily chart, bitcoin is in the midst of a bullish reversal following a significant downtrend that bottomed out around $107,270. Since that low, price action has formed a clear sequence of higher highs and higher lows, with volume gradually increasing—an encouraging sign of conviction. The asset now tests key resistance near the $116,000 level, with a strong close above this region needed to confirm further upside. Entry zones were more favorable during the reversal, but trailing stop strategies near $113,500 could help protect gains for those already long. Price targets range from $117,500 to $120,000 based on resistance clusters.
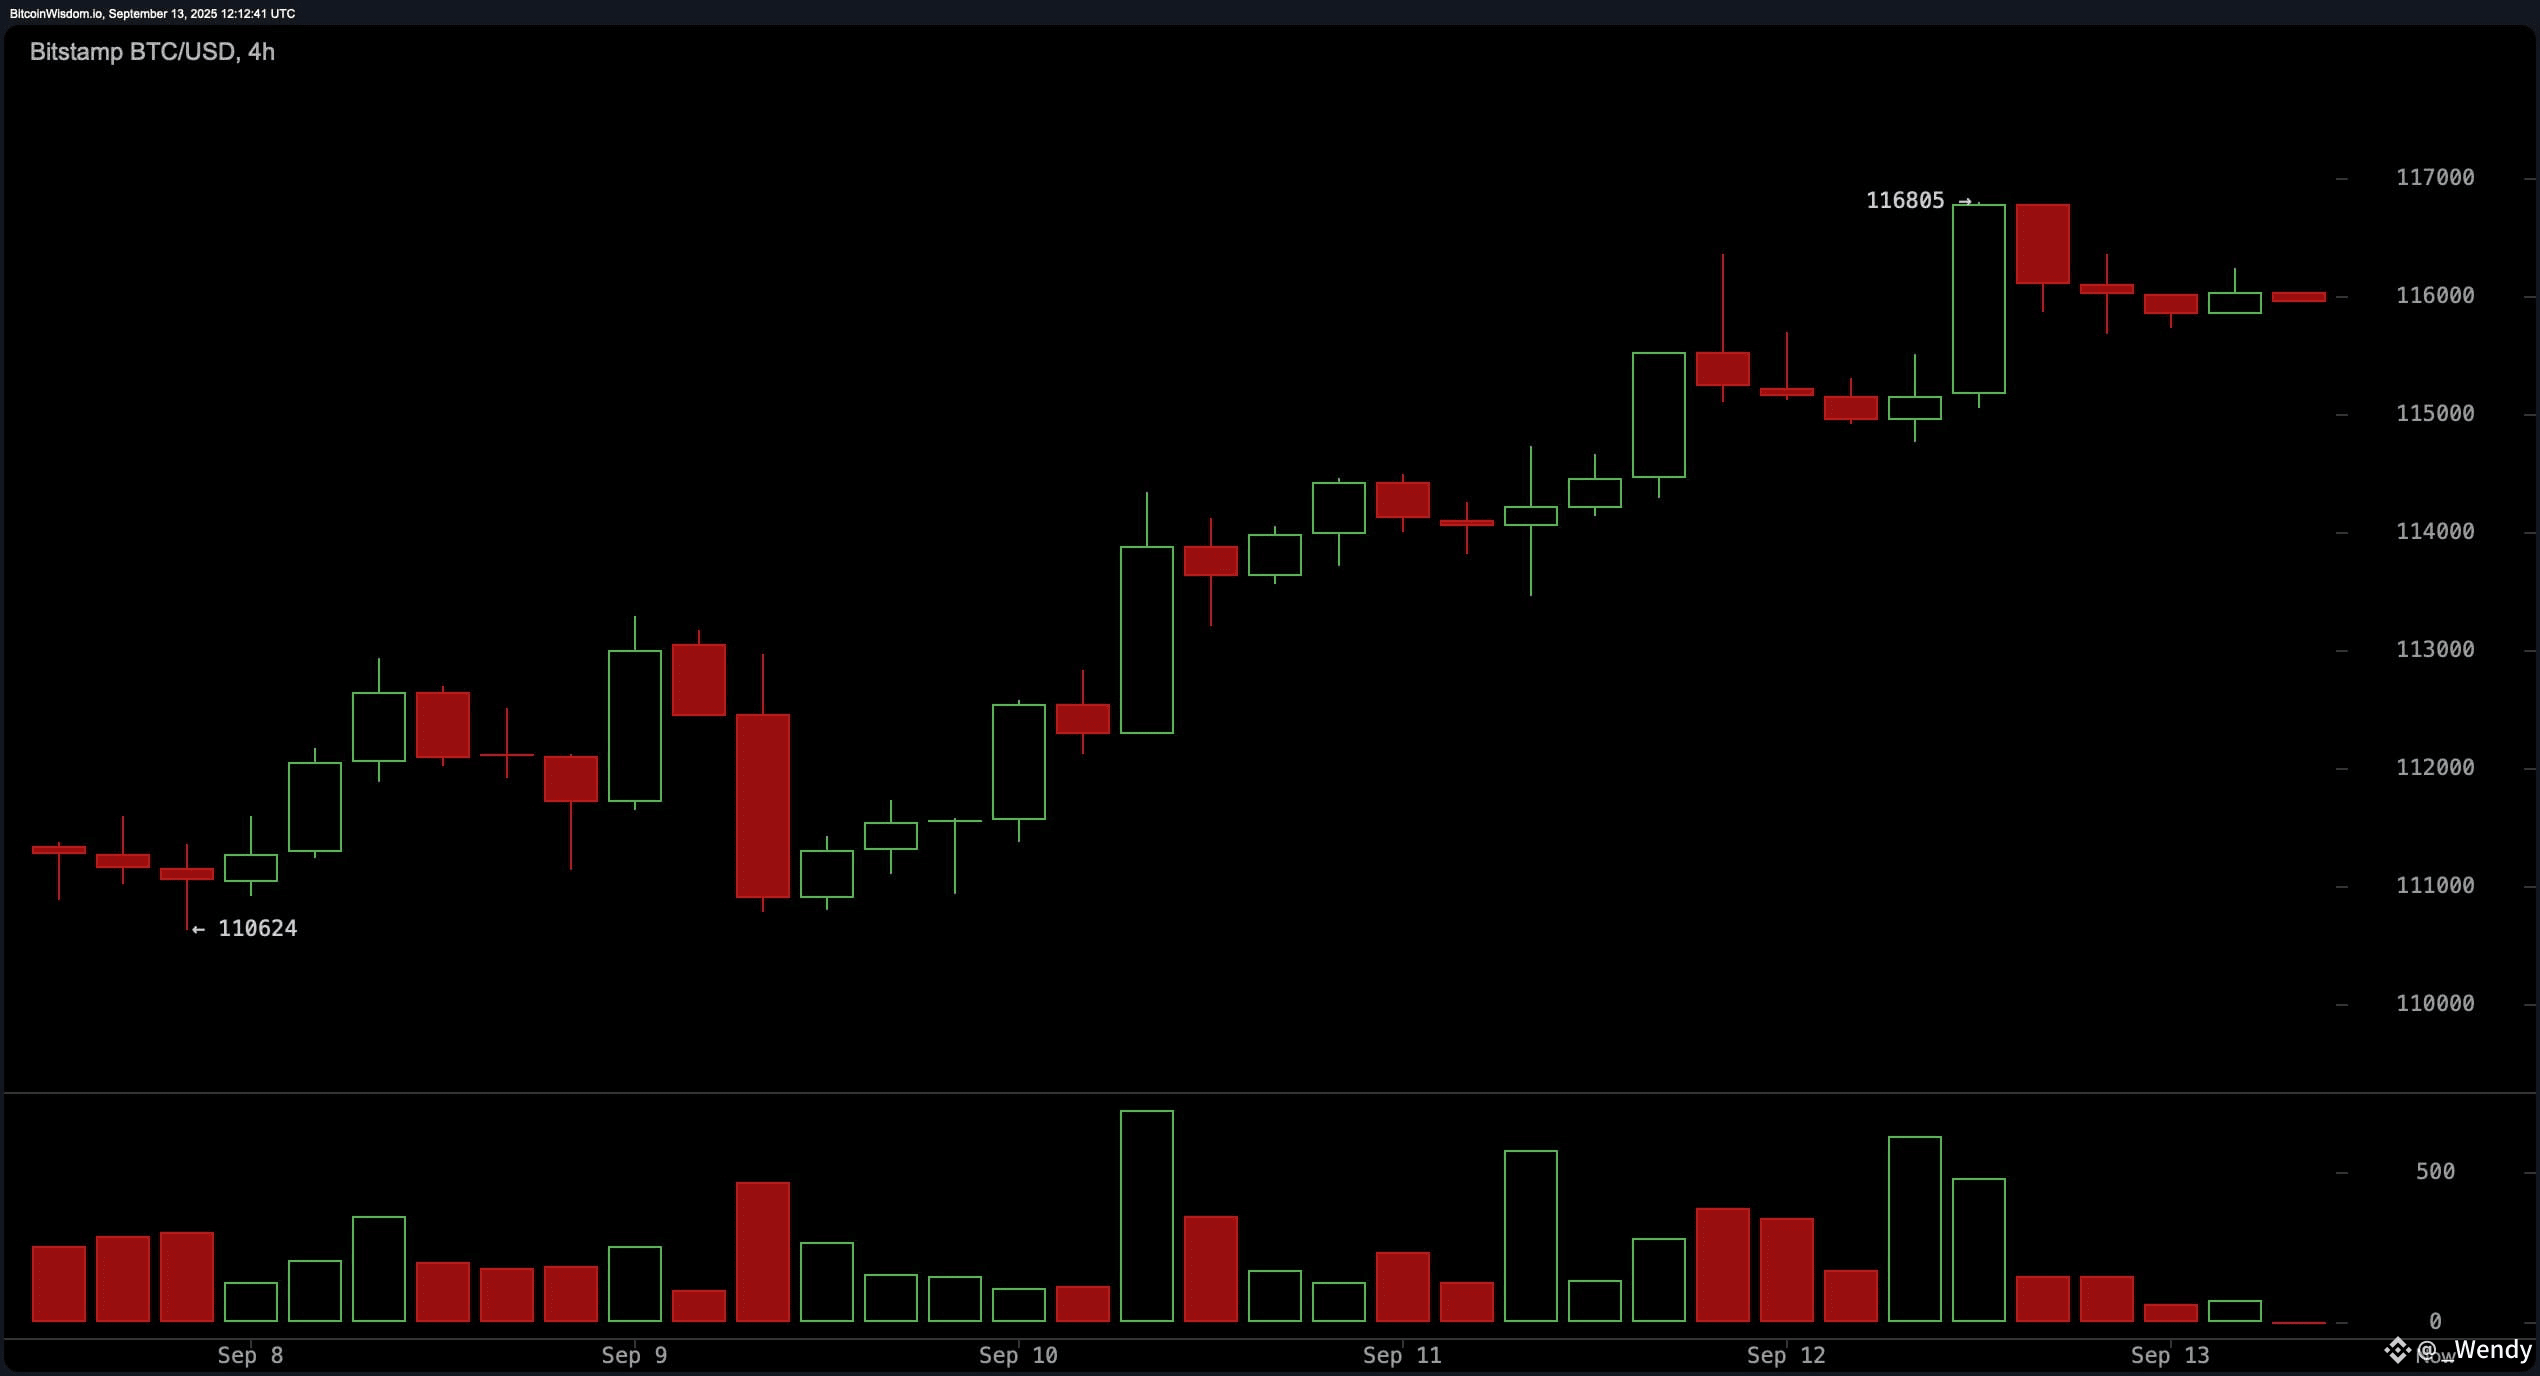
The 4-hour bitcoin chart presents a strong bullish continuation pattern, originating from a breakout at $110,624 and peaking at $116,805. Although the rally remains intact, recent candles are exhibiting smaller bodies, signaling a pause in momentum. Buyers appear to be taking a breather, with support forming between $114,500 and $115,000. A confirmed breakout above $117,000 could accelerate gains toward $118,000 or higher, provided volume accompanies the move. Cautious bulls may consider entries on retests of support or during breakouts with strong volume confirmation.
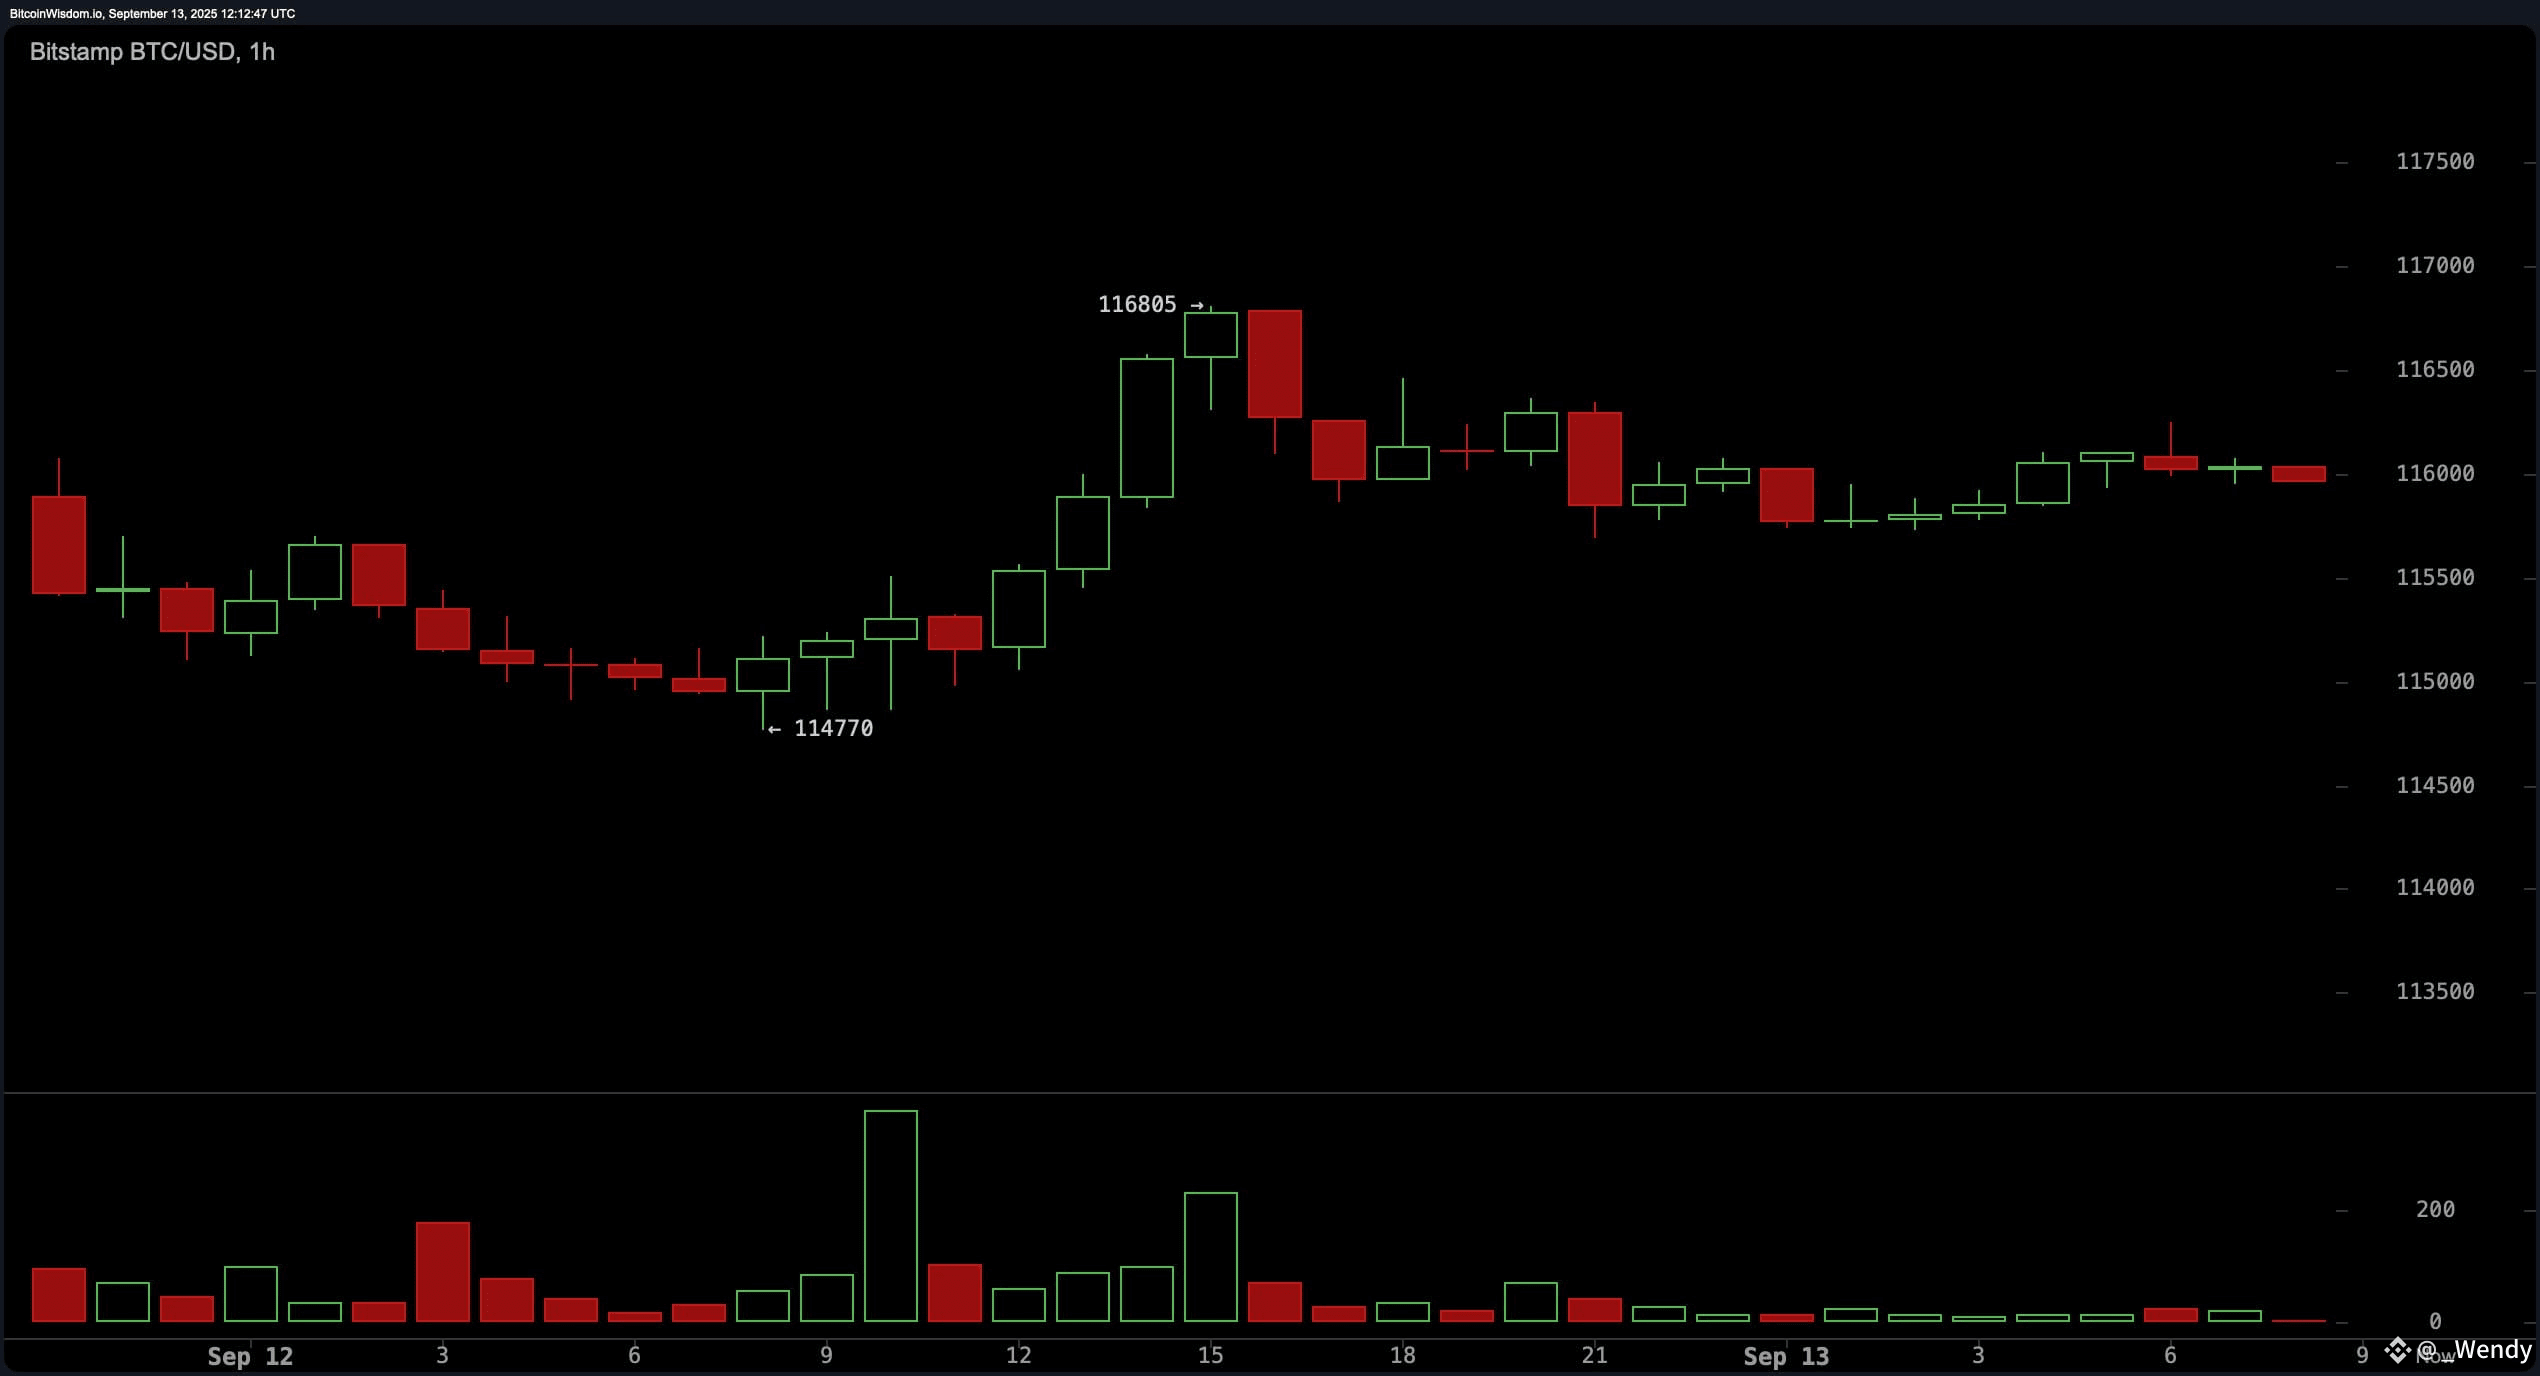
On the 1-hour chart, bitcoin is consolidating beneath the $116,805 high, forming what appears to be a bullish flag or range-bound setup. Momentum is cooling, but not reversing, which often precedes a continuation move. Short-term support lies near $114,770, with buyers still in control as long as the price remains above $115,500. Scalpers may find opportunities in a breakout above $116,800 or a bounce near the $115,000 level, though stops should be kept tight under $114,770 due to the possibility of short-term pullbacks.
Oscillators present a mixed picture. The relative strength index (RSI) sits at 59, suggesting neutral momentum without overbought conditions. The stochastic oscillator is elevated at 95, indicating potential overbought signals. The commodity channel index (CCI) at 195 and momentum at 4,219 both issue a sell signal, hinting at waning upward drive. Meanwhile, the awesome oscillator at 475 and the moving average convergence divergence (MACD) level at 202 both show buy signals, suggesting the broader trend remains intact. This divergence in indicators calls for cautious optimism, with a focus on volume-supported moves.
Bull Verdict:
With bitcoin holding above key support zones and all major moving averages aligned to the upside, the broader technical structure remains bullish. If buyers can push through the $117,000 resistance with strong volume, the path toward $120,000 appears viable in the near term.
Bear Verdict:
Despite the bullish structure, overstretched oscillators and waning intraday momentum suggest caution. A breakdown below $114,770 on volume could shift short-term sentiment bearish and trigger a deeper retracement toward previous consolidation levels near $113,500.
Follow Wendy for more latest updates
