The current market structure for AIA presents a fascinating case study in volatility compression and the cyclical nature of asset pricing within the digital asset ecosystem. As we observe the latest price action, it becomes evident that the asset is emerging from a prolonged period of consolidation, a phase often characterized by the transfer of inventory from weak hands to stronger, long-term holders. The technical landscape is currently defined by a tightening of trading ranges followed by an initial attempt to establish a new directional bias. This analysis aims to dissect the underlying market mechanics driving the current price behavior, utilizing the provided chart to identify key liquidity pockets, momentum shifts, and critical inflection points. By stripping away the noise and focusing on pure price action and market structure, we can derive a probabilistic roadmap for the immediate to mid-term future. The interplay between moving averages and volatility bands suggests that the market is reaching a decision point, one that could dictate the trend for the coming weeks.
Market Snapshot:
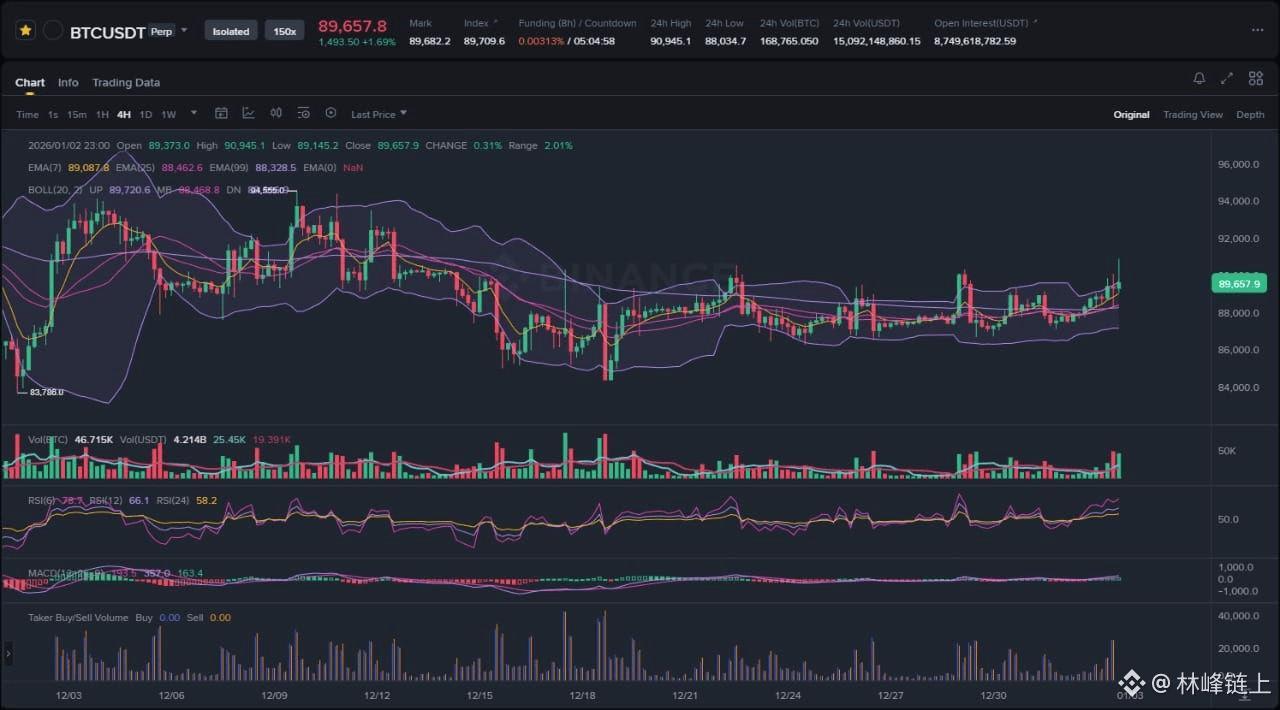
The attached chart reveals an asset that has undergone a significant corrective phase followed by a period of stabilization. The price action is currently interacting with the upper boundaries of its recent trading range, signaling a potential shift in market sentiment from defensive to offensive. The visual data indicates a classic volatility squeeze, where the price has been compressed between converging technical levels. This compression is evident in the narrowing of the Bollinger Bands in the central portion of the chart, followed by a slight expansion as the price attempts to push higher. The volume profile shows intermittent spikes, suggesting that while participation is present, a definitive breakout surge has yet to be fully realized. The asset is currently trading above its short-term moving averages, a constructive sign that indicates buyers are stepping in to support higher lows. However, the presence of overhead resistance structures reminds us that the transition from a range-bound market to a trending market is rarely a straight line; it requires sustained momentum and the absorption of supply at key levels.
Chart Read:
A granular examination of the technical indicators provides a deeper understanding of the current setup. The most prominent feature on the chart is the behavior of the Bollinger Bands. After a period of contraction, which signifies low volatility and typically precedes a significant expansion or "explosive move," the price is now challenging the upper band. In technical analysis, a close above the upper band, accompanied by the bands widening, is often interpreted as a signal of volatility expansion in the direction of the trend. Currently, the price is "walking the bands," a phenomenon where the asset hugs the upper deviation line, indicating strong buying pressure.
Furthermore, the Exponential Moving Averages (EMAs) are beginning to align in a bullish configuration. The shorter-term 7-period EMA has crossed above the intermediate 25-period EMA, providing dynamic support for the price action. This "Golden Cross" on a lower timeframe serves as a lagging but confirming indicator that momentum has shifted to the upside. The 99-period EMA, representing the longer-term trend, sits below the current price action, acting as a foundational support floor. The distance between the price and this long-term average suggests that the asset is not yet overextended, leaving room for further upside before mean reversion mechanics typically kick in.
Momentum oscillators further corroborate this view. The MACD (Moving Average Convergence Divergence) histogram is showing signs of flipping positive, with the signal lines diverging upwards. This indicates that the velocity of the price increase is accelerating. Meanwhile, the RSI (Relative Strength Index) is rising but has not yet reached extreme overbought levels, suggesting there is still capacity for buyers to enter the market without immediately facing exhaustion. The chart structure essentially depicts a "rounding bottom" or accumulation pattern, where the aggressive selling pressure seen on the left side of the chart has been neutralized, replaced by a steady grind higher.
News Drivers:
In the absence of specific, high-impact news headlines for AIA at this exact moment, the market is driven primarily by technical factors and broader sector sentiment. This "news vacuum" is a critical theme to analyze.
Theme 1: Technical Dominance and Algorithmic Trading. When there is a lack of fundamental catalysts or press releases, price action is often dominated by technical trading algorithms and liquidity providers. In this environment, the chart patterns discussed above—specifically the Bollinger Band squeeze and EMA crossovers—become self-fulfilling prophecies. Traders and automated systems react to these levels because there is no external narrative to contradict them. The silence allows the "pure" market structure to play out, where price moves towards areas of liquidity.
Theme 2: Silent Accumulation. A lack of news is not necessarily bearish; in fact, it often characterizes the accumulation phase. Smart money and institutional players prefer to build positions when the hype cycle is low and media attention is elsewhere. The steady price appreciation seen on the right side of the chart, despite a lack of "breaking news," suggests organic demand. This is often healthier than news-driven pumps, as it builds a more stable support structure.
Theme 3: Correlation with Macro Trends. Without idiosyncratic news for AIA, the asset is likely functioning as a high-beta play on the broader crypto market. If the major indices (like Bitcoin or Ethereum) are trending upwards, assets with sound technical structures like AIA will often outperform as capital rotates into higher-risk, higher-reward opportunities. The "no news" environment means AIA is currently tethered to general market beta, making the overall crypto market sentiment a key external variable to watch.
Scenario A (Primary):
For the bullish bias to be confirmed and for the trend to accelerate, the price must successfully convert the upper Bollinger Band from a resistance level into a support zone. In this primary scenario, we look for a "breakout and retest" pattern. The price should close decisively above the recent local highs, ideally accompanied by a visible spike in volume. Following this breakout, a minor pullback to test the breakout level (or the 7-period EMA) would be healthy. If buyers step in at this retest, it confirms that previous resistance has flipped to support. This would open the door for a continuation move towards the next major liquidity level. The objective here is a sustained expansion of the Bollinger Bands, with the price riding the upper band upwards. This scenario relies on the MACD continuing its ascent and the RSI maintaining its trajectory without forming a bearish divergence. Essentially, the market needs to prove that the current move is not just a volatility spike, but the start of a new trend.
Scenario B (Alternative):
The alternative scenario involves a "fakeout" or a failure to sustain momentum at resistance. If the price pushes above the upper Bollinger Band but immediately faces a sharp rejection, closing back inside the range with a long upper wick, this would signal a "bull trap." In this scenario, the breakout attempt fails to attract new buyers, and existing holders use the liquidity to exit their positions. The price would likely revert to the mean, targeting the middle Bollinger Band (the basis) or the 99-period EMA as the next area of interest. A breakdown below the 25-period EMA would invalidate the short-term bullish thesis and suggest that the asset is returning to a consolidation or distribution phase. This scenario is often preceded by a bearish divergence on the RSI, where price makes a higher high while the oscillator makes a lower high, indicating waning momentum.
What to Watch Next:
Traders and analysts should focus on three specific actionable signals in the coming sessions. First, watch the volume on any upward move. A price increase on low volume is suspect and prone to reversal; we want to see volume expansion that matches the price expansion. Second, monitor the angle of the 7-period EMA. As long as this moving average remains steeply sloped upwards, the immediate trend is safe. If it begins to flatten or curl down, it is an early warning sign of momentum loss. Third, pay attention to the interaction with the upper Bollinger Band. A "tag" of the band followed by a retreat is normal, but a "ride" along the band indicates a strong trend. Conversely, a sharp rejection at the band suggests the market is overextended and due for a pullback. Finally, keep an eye on the order book depth if available; a thinning of the ask side would facilitate the Scenario A breakout, while a wall of sell orders would increase the probability of Scenario B.
Risk Note:
While the technical structure shows promise, markets are probabilistic, not deterministic. The presence of a volatility squeeze implies that a large move is imminent, but it does not guarantee the direction. False breakouts are common in this stage of the market cycle. Furthermore, the "no news" environment means that a sudden external shock—regulatory news, a macro event, or a project-specific announcement—could rapidly invalidate the technical setup. Always manage risk by defining invalidation points where the thesis is proven wrong, rather than relying solely on the expectation of a profitable outcome.