A Long-Term Perspective
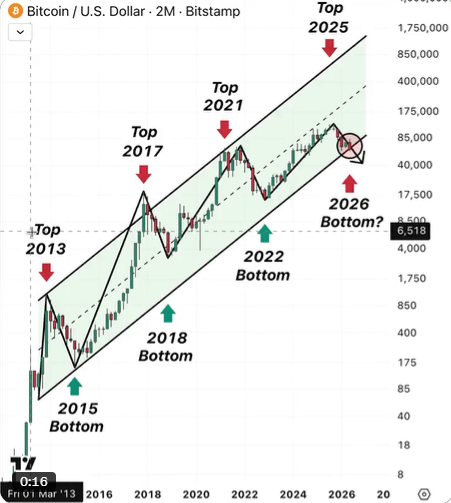
Most investors spend their time looking for the next headline. Very few spend time looking at the structure that has guided Bitcoin for more than a decade. That is why the current chart deserves attention. Since 2013, Bitcoin has respected a long-term ascending channel through multiple bull markets, brutal crashes, and periods when most people believed the story was over.
The chart highlights every major cycle. The 2013 top was followed by a deep correction, yet price remained inside the broader channel. The same pattern appeared after the euphoric 2017 rally. In 2021, another cycle peak formed, followed by a painful decline into the 2022 bottom. Despite the volatility, the long-term structure remained intact.
Today the market is testing that structure again. This is why opinions have become so divided. Some traders believe Bitcoin is about to lose the channel that has supported it for years. Others believe this is simply another emotional shakeout before the trend continues. Both arguments have logic behind them.
When markets reach critical technical areas, emotions usually become louder than facts. Fear grows because investors remember previous crashes. Optimism survives because Bitcoin has repeatedly recovered from situations that once looked impossible. History does not repeat perfectly, but recurring behavior is one reason long-term technical structures deserve attention.
A confirmed breakdown would certainly change the conversation. It could signal that the market needs more time to build a durable foundation before another expansion phase begins. Such a move would likely create panic among late buyers while encouraging aggressive bearish positioning.
However, experienced investors also know that false breakdowns are common. Financial markets frequently move beyond obvious support or resistance before reversing sharply. These fake moves often force impatient participants out of their positions just before momentum changes direction.
Instead of predicting an exact price target, it is often wiser to watch confirmation. Does price reclaim the channel quickly? Does buying volume increase? Are long-term holders distributing or accumulating? These questions matter far more than a single dramatic forecast on social media.
Another important factor is psychology. Bull markets rarely end when everyone expects them to end, and bear markets rarely begin with perfect clarity. The largest moves usually happen after the market convinces the majority that only one outcome is possible.
Risk management remains the most valuable tool. Even if the bullish thesis proves correct, disciplined position sizing allows investors to survive uncertainty. If the bearish scenario unfolds, protecting capital today creates opportunities tomorrow.
Whether Bitcoin ultimately holds this channel or loses it, the current moment will probably become one of the defining chapters of this cycle. The next reaction around this historical support may influence sentiment for months, perhaps even years.
Rather than asking whether someone can predict the exact bottom, a better question is whether the market is providing enough evidence to justify conviction. Patience is often rewarded more than certainty.
One thing is clear: this chart deserves a place on every long-term investor's watchlist. Major trends often begin quietly, while the crowd is focused on short-term noise instead of the bigger picture.
Do you believe Bitcoin is preparing for another historic recovery, or is the long-term channel finally ready to break after more than a decade? I'd love to hear your view.
$BTC
#Bitcoin #Crypto #BullMarket