
Bitcoin (BTC) is approaching a critical juncture, with analysts forecasting a potential price discovery phase if it breaches the $110,000 level. As of May 21, BTC is trading around $107,457, just below its all-time high. The asset has already recorded a weekly close at $106,407, and if it ends May above $102,400, it would mark Bitcoin’s highest monthly close in history.

$3 Billion in BTC Shorts at Risk Above $107,000
Market analysts estimate that more than $3 billion in leveraged short positions could be liquidated if Bitcoin sustains a move above $107,000. According to trading data, this creates a so-called “liquidation magnet”—a technical condition where concentrated short positions act as upward fuel if breached, accelerating bullish momentum.
Crypto trader Jelle described the market as being “inches away” from price discovery, a term used when an asset enters a previously uncharted range with no historical resistance, allowing price to be determined by real-time market dynamics.

Technical Indicators Signal Breakout Potential
Bitcoin is on the verge of confirming a golden cross on the daily chart—a bullish signal formed when the 50-day moving average crosses above the 200-day moving average. Historically, this pattern has preceded price rallies ranging between 45% and 60%. If confirmed, this could push BTC well past its previous all-time high and into a new trading range above $110,000.
A monthly close at or near $110,000 would represent a 15–17% gain for May, marking its strongest May performance since 2019, and nearly double the historical average monthly return of 8% for the month.

Compression Patterns Mirror 2017 Bull Run
Bitcoin researcher Axel Adler Jr. noted that BTC is currently undergoing its third major price compression phase of this cycle, measured using a 180-day rolling maximum/minimum range. This pattern mirrors the 2017 rally, where Bitcoin surged from $1,000 to $20,000 following a supply-driven squeeze and increased retail demand post-halving.
Bollinger Bands also show tightening volatility, a technical signal often associated with imminent breakouts. As volatility builds, traders are closely watching for a decisive move, according to Cointelegraph.
Liquidity Skew Suggests Upside Breakout More Likely
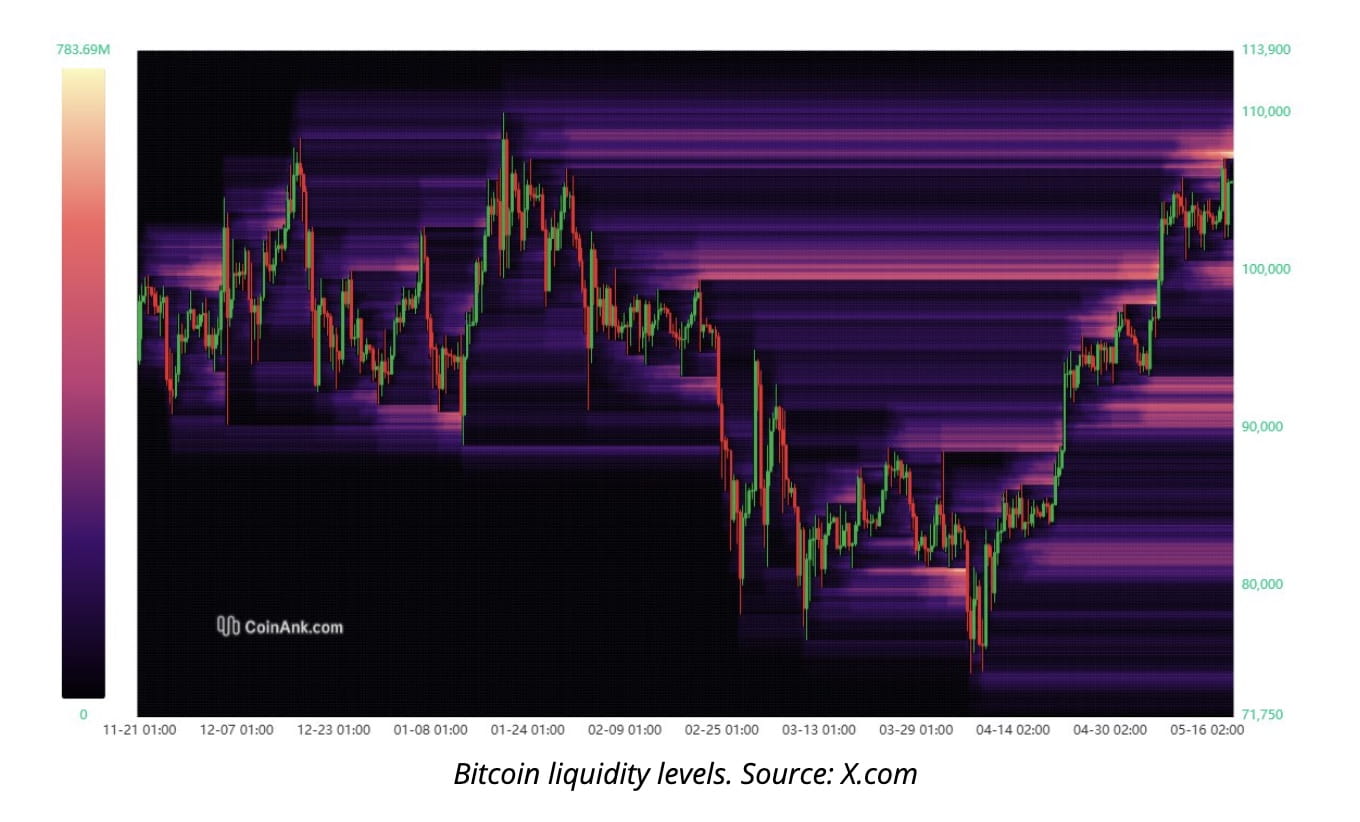
According to current liquidation data, a move to $110,000 would trigger approximately $3 billion in short liquidations, while it would take a drop to $94,612 to generate an equivalent amount in long liquidations. This asymmetry in risk positioning indicates a higher probability of BTC moving upward to clear sell-side liquidity.
Technical analyst Gert van Lagen emphasized this outlook, stating:
“A liquidation magnet is glowing above $107K, ready to vaporize billions in shorts. First, BTC soared on fear. Next, it'll rise on liquidations.”
