#USGDPUpdate 📊 Key Data (Q3 2025 Initial Estimate)
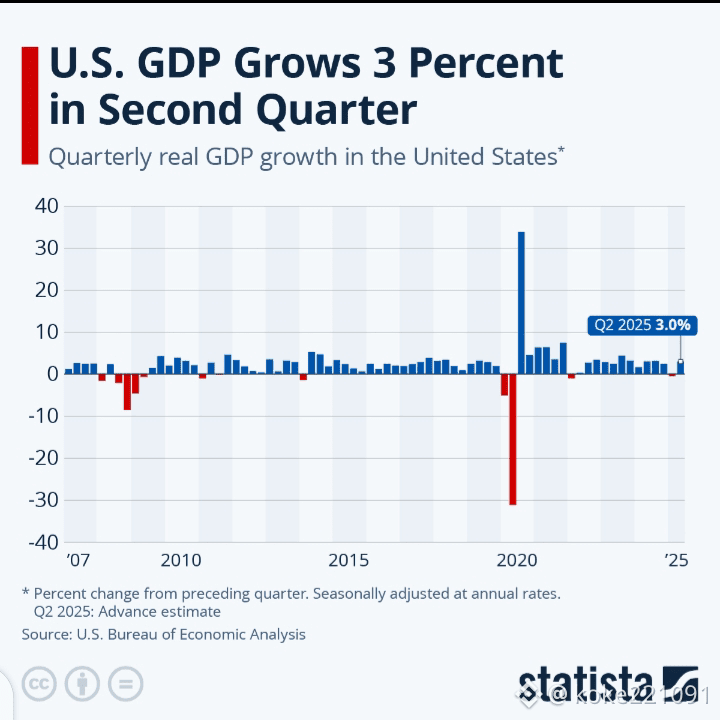
Real GDP growth: +4.3% annualized — strongest in two years. �
Bureau of Economic Analysis
Previous quarter (Q2) growth: +3.8%. �
Bureau of Economic Analysis
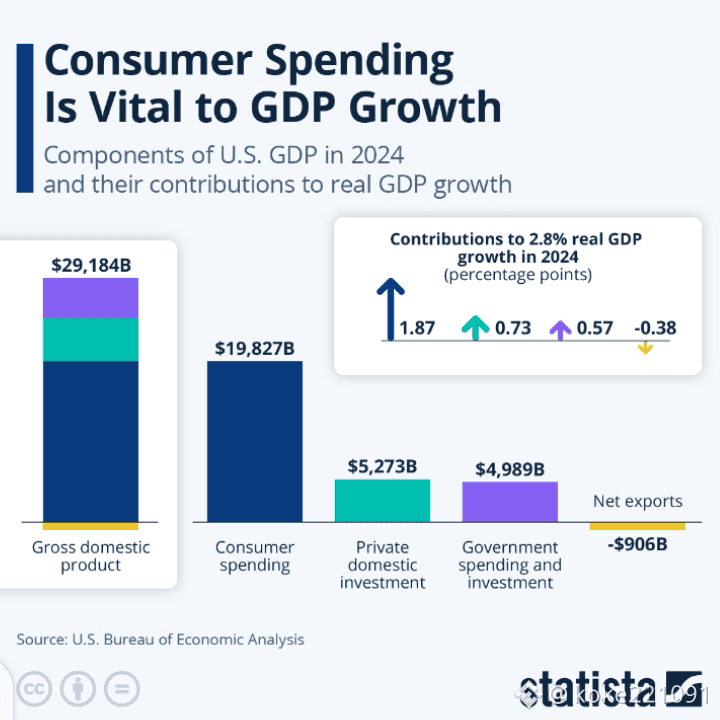
Growth was driven primarily by:
Consumer spending increases
Rising exports
Higher government spending
Reduced imports (which boosts net GDP) �
Bureau of Economic Analysis
This result beat many economists’ expectations and reflects a rebound in demand across major sectors. �
Bureau of Economic Analysis
🧠 What’s Fueling the Growth?
The latest GDP surge reflects several catalysts:
1. Consumer Spending
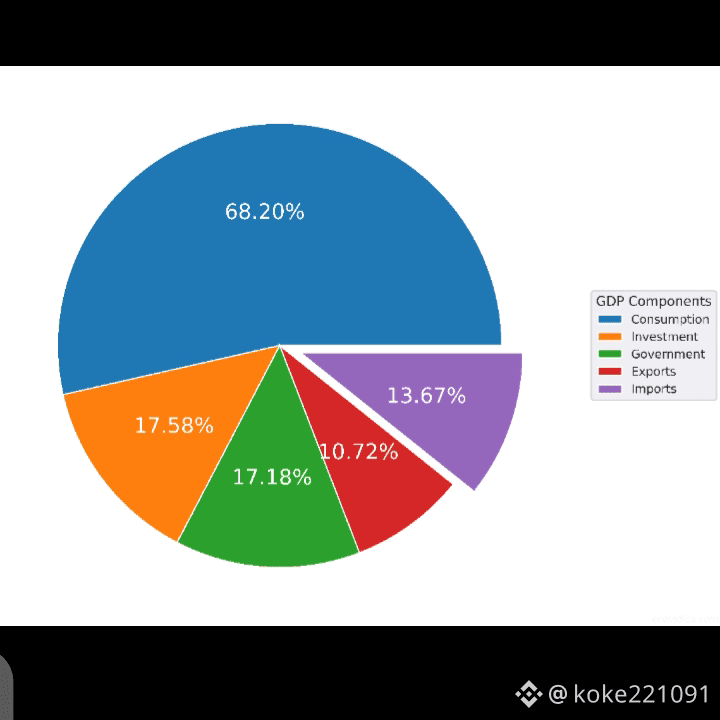
U.S. households continued to spend on services and goods, which supports roughly two-thirds of total GDP.
2. Exports
Exports grew strongly, helping the trade balance contribute positively to GDP.
3. Government Spending
Federal and state outlays increased, supporting infrastructure, healthcare, and defense sectors.
Despite this, business investment dipped slightly, partially offsetting gains. �
Bureau of Economic Analysis
🔮 Short-Term Outlook
📈 Q4 2025 Nowcasts
The Atlanta Fed’s GDPNow model estimates ~3.0% growth for Q4 2025. �
This suggests continued expansion, but slower than Q3.
Federal Reserve Bank of Atlanta
📉 Annual Forecasts
Professional forecasters project ~1.9% annual average GDP growth in 2025. �
Federal Reserve Bank of Philadelphia
This reflects a moderation from the mid-year acceleration and aligns with broader global economic slowing.
🔍 Broader Context
📌 Nominal GDP Size (2025)
U.S. nominal GDP is over $30 trillion according to IMF estimates — making it the largest economy in the world. �
Worldometer
📌 GDP per Capita
GDP per capita is around $89,600 (2025 estimate), reflecting gradual income growth. �
Worldometer
📌 Sector Drivers
Services, tech innovations (e.g., AI investments) and consumer resilience are critical drivers; manufacturing growth remains moderate. �
EY
📍 Risks & Challenges Ahead
🔸 Inflation & Fed Policy
Core inflation measures remain above the Fed’s 2% target, making rate decisions delicate.
🔸 Government Data Gaps
Recent federal shutdowns delayed some economic data releases — adding uncertainty to GDP figures.
🔸 Uneven Recovery
Growth gains are not uniform across income groups, with lower-income households showing weaker progress.
🔸 Debt Levels
U.S. federal debt remains near record highs (~$38 trillion), influencing fiscal policy and risk assessments. �
Wikipedia