We have officially touched a critical structural threshold. The daily Z-Score has hit –2.10. In the history of $BTC, entering this specific zone has triggered a significant bounce every single time:
August 2021: –2.1 → +40% in 3 weeks
March 2020: –2.3 → +80% in 6 weeks
June 2022: –2.2 → +30% temporary relief
We are there again. Right now.
🔍 What the Data Shows
Z-Score 1D: –2.10 (Extreme oversold boundary — institutional green zone).
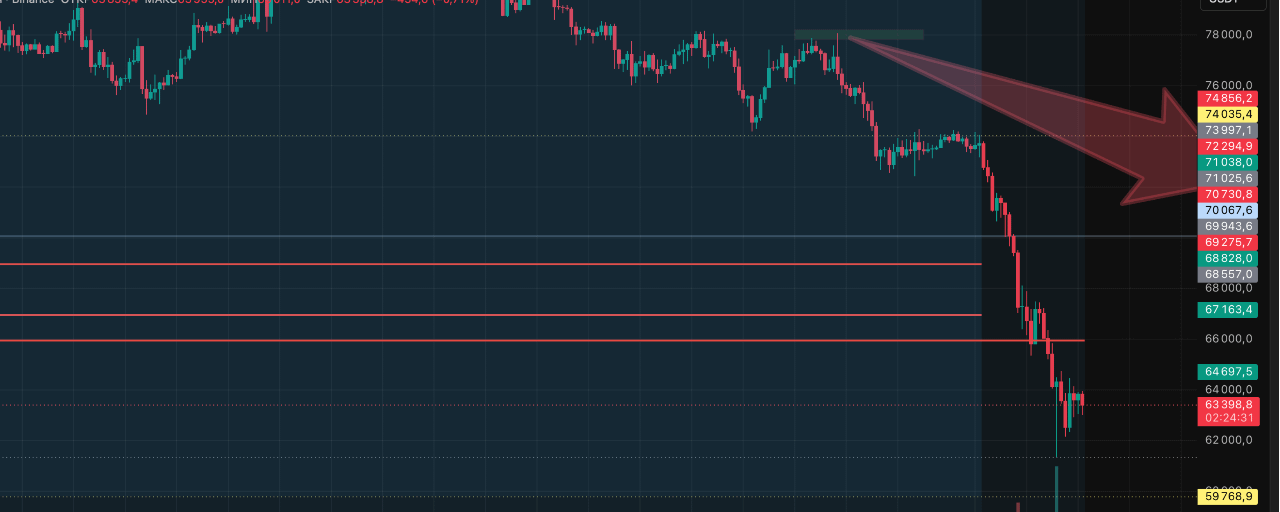
Volume Profile POC: $64K–$67K (Maximum historical volume cluster acting as a heavy magnet).
Current Price: $63,400 — sitting directly on the Point of Control (POC).
The June 2–4 Dump: Volume on this capitulation move is the highest recorded in all of 2026.
The Macro Combination: Historical volume spike + Z-Score floor = Systemic capitulation followed by an incoming relief rally.
But here is what most retail traders miss: A Z-Score bounce does not equal an immediate macro trend reversal. This is a technical counter-move inside a localized downtrend.
🛡️ My Exact Execution Blueprint
I am not guessing. I am executing based on strict data confirmation.
❌ Not chasing or market-buying here at $63.4K.
⚡ Waiting for a clean 4H candle close above $65,000 to confirm the front-run.
📈 Triggering LONG only after validation.
Stop Loss (SL): $61,500
Take Profit 1 (TP): $68,828
Take Profit 2 (TP): $71,038
Take Profit 3 (TP): $74,035
📍 The Line in the Sand: $59,768
This is the last real structural defense before a macro drop to $53K. If $59,768 breaks — the massive double top pattern from the $120K measured move becomes active, targeting exactly $53,572. The math does not lie.
Two Outcomes. Zero Middle Ground:
🟢 Scenario 1: Successful bounce from the $60K–$65K zone → Recovery rally targeting $70K–$74K.
🔴 Scenario 2: Clean break of $59,768 → High-velocity cascade straight to $53K.
I am watching the tape, not front-running the signal. One 4H close above $65K changes everything. 👁️
more information DM
#BTC #bitcoin #CryptoAnalysis" #BinanceSquare #TechnicalAnalysis