Binance traders, have you taken a close look at the $LAB chart lately? 👀
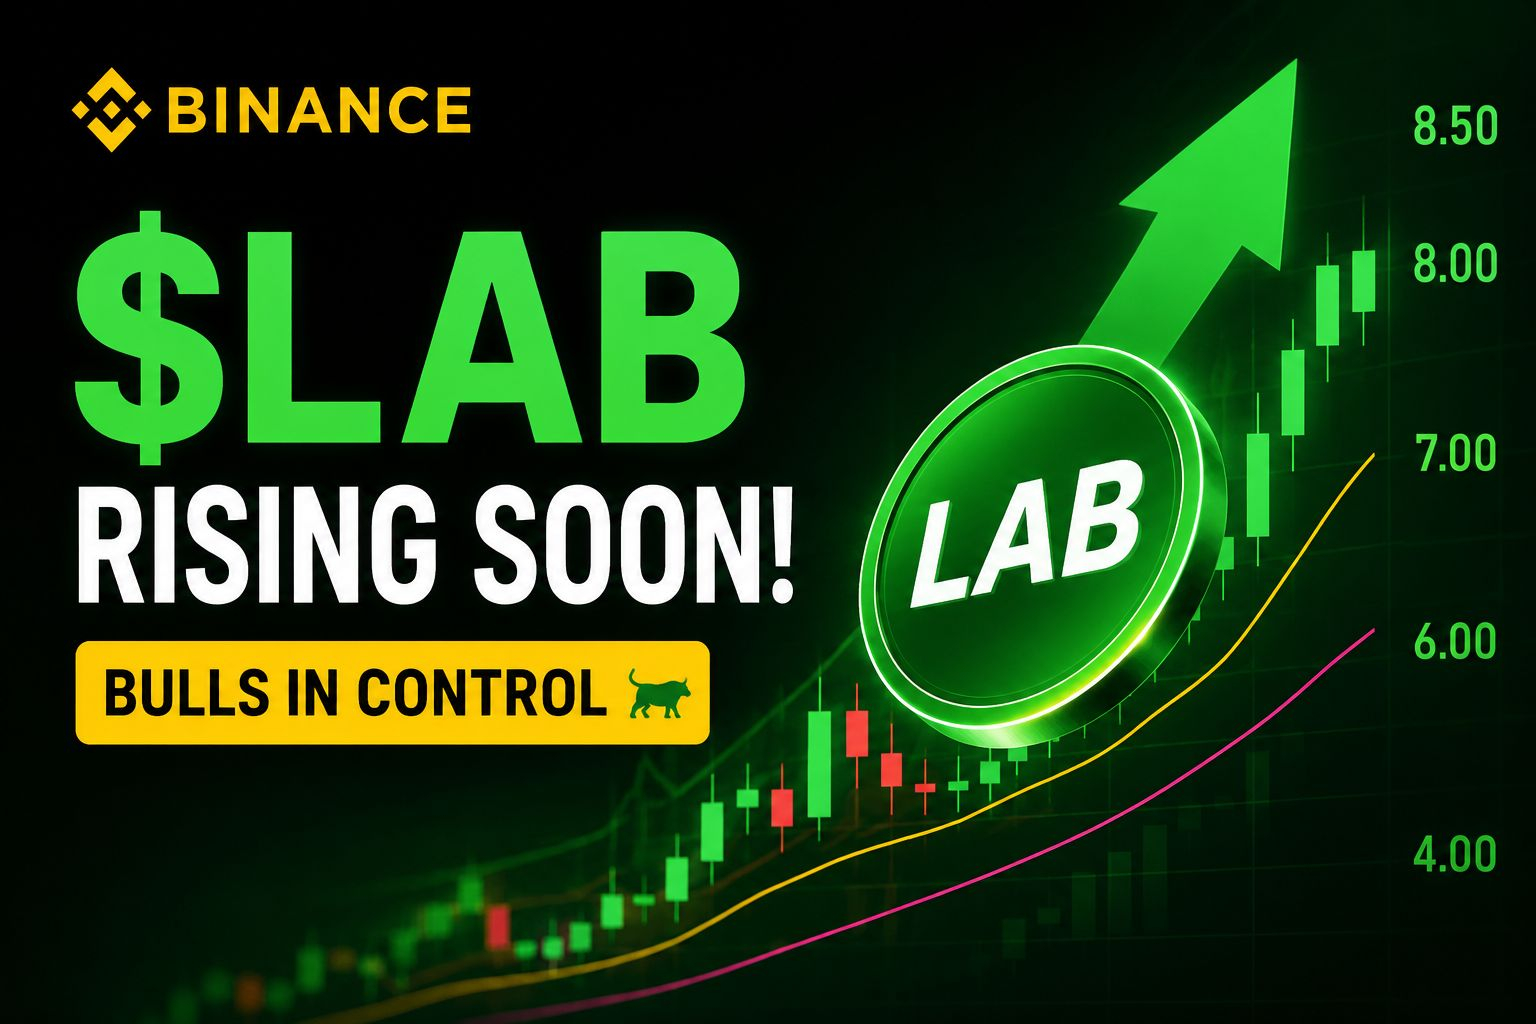
On the 1-hour timeframe, LABUSDT is showing an incredibly strong bullish structure. After climbing from a local low near $4.07, the price has surged to around $7.60+, demonstrating powerful momentum and growing market interest.
✅ Clear Higher Highs and Higher Lows are forming.
✅ Price is trading well above the MA7, MA25, and MA99, confirming a strong uptrend.
✅ Increasing trading volume suggests growing buyer confidence.
✅ Consecutive bullish candles continue to push the market higher.
However, there is one important factor to keep in mind:
⚠️ The RSI is above 93, indicating an overbought condition. This doesn't necessarily mean the rally is over, but it does suggest that a short-term pullback or consolidation could occur before the next leg higher. As long as key support levels hold, the overall trend remains strongly bullish.
🎯 Potential Targets
If the current momentum continues, traders could be watching:
🔹 $8.00 – Major psychological resistance
🔹 $8.50 – Next significant bullish target
🔹 Beyond that, LAB could enter a new phase of price discovery if buying pressure remains strong
💡 What Binance Traders Should Watch
LAB is currently displaying the three ingredients every trader looks for: momentum, volume, and trend strength. While smart traders always manage risk and avoid chasing pumps blindly, the chart is clearly showing that the bulls remain firmly in control.
The big question is whether this momentum can continue and attract even more buyers in the coming sessions.
❓Question for the Community
Do you think $LAB will hit $10 first, or will $8 act as a major resistance zone and slow the rally down? 👇🔥