Market Structure Overview
Bitcoin's daily chart on Binance tells a story of a market that got aggressively euphoric, corrected sharply, and is now attempting a methodical recovery. After printing a cycle high of $94,553 in early January 2026, BTC entered a prolonged distribution phase that culminated in a brutal markdown through February, bottoming near the $61,303 support band — a drawdown of over 35% from the peak.
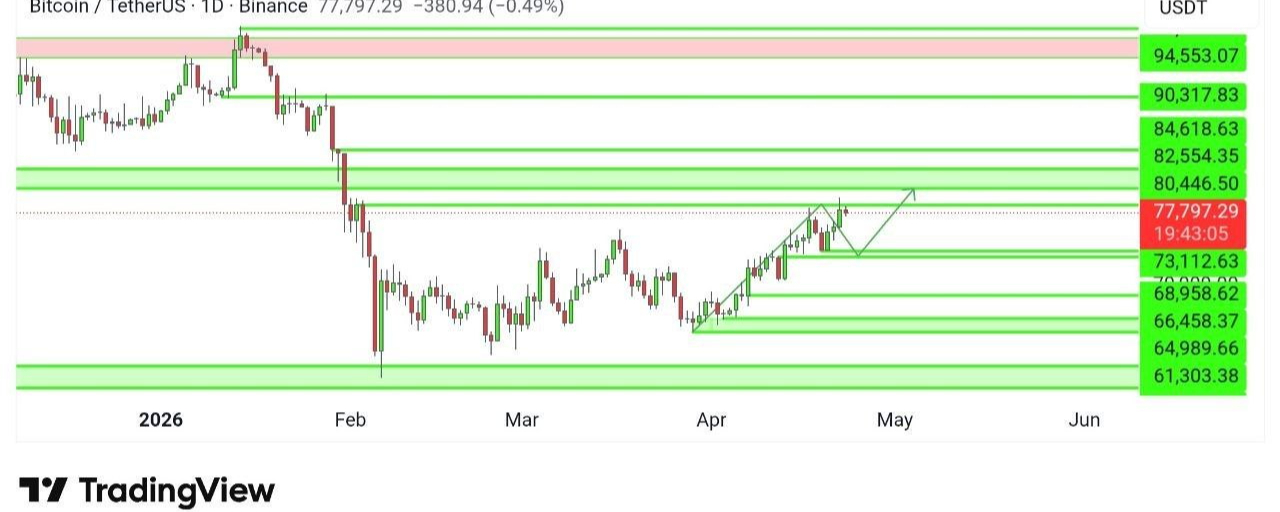
The recovery since the April lows has been steady but not explosive. Price has reclaimed the $73,112 level and is now testing the critical $77,797 zone, where it currently trades. The presence of a projected price path drawn directly on the chart — showing a brief pullback followed by a push toward $80,446 — suggests the analyst expects a short-term consolidation before the next leg higher.
The Charted Projection: Reading the Price Path
The most actionable piece of this chart is the analyst's drawn price trajectory — a green arrow path plotted into May 2026. The path anticipates a minor pullback from the current $77,797 region down toward $73,112 support, likely a healthy retest of the breakout level, before a renewed push upward targeting the $80,446–$82,554 resistance cluster.
This is a classic "flag and pole" or "break-retest-continue" setup. The sharp rally from April lows to current levels represents the pole. The expected pullback to $73K would form the flag or consolidation base before continuation. Critically, this scenario only holds if $73,112 holds on any dip. A decisive close below that level invites a retest of the $68,958–$66,458 zone.
Macro Picture: The Weight of the Supply Zone
The most daunting feature of this chart is the red overhead supply band beginning at approximately $94,000. This represents the heaviest concentration of sellers from the January peak — investors who bought near the top and are waiting to break even. Even in a strongly bullish scenario, Bitcoin will need to absorb enormous sell pressure before a new all-time high becomes achievable.
Between current price and the supply zone lies a gauntlet of five resistance levels: $80,446 → $82,554 → $84,618 → $90,317 → $94,553. Each of these will need to be systematically cleared. Based on the pace of recovery, this could take several months — consistent with a potential new ATH attempt in Q3 or Q4 2026 if macro conditions cooperate.
Bull case
Price holds $73,112 on any pullback, bounces cleanly, and breaks $80,446 with strong volume. Each resistance level from $82K–$90K is cleared on successive weekly closes, setting up a Q3 ATH attempt above $94,553.Bear case
Current momentum stalls below $80K. A loss of $73,112 triggers cascading support failures through $68K → $66K → $64K. Bears regain control and a retest of the $61,303 cycle low becomes likely before any meaningful recovery.
Trading Implications
For position traders, the risk/reward currently favors waiting for either a confirmed breakout above $80,446 or a clean pullback entry around $73,112. Chasing price at $77,797 into dense resistance is not an asymmetric bet. For swing traders, the $73K support retest — if and when it occurs — represents the highest-quality entry in the near-term setup with a clear invalidation below $70,000.
Dollar-cost accumulators building a long-term Bitcoin reserve (such as a mining-first accumulation model) have no reason to alter strategy — each dip toward the $64K–$68K zone represents structurally cheap BTC relative to the cycle trajectory.
Analyst Verdict
Bitcoin is in a recovery phase following a 35% drawdown, with a charted projection suggesting a pullback to $73,112 before a continuation toward $80K+. The overall bias is cautiously bullish, but the road to new all-time highs is long — five resistance levels stand between current price and the $94,553 supply ceiling. Watch $73,112 as the key bull/bear dividing line over the next 2–4 weeks.
