📉 ETHEREUM $ETH
ON THE EDGE: Will This Bearish Pattern Trigger a Pullback? ⚠️
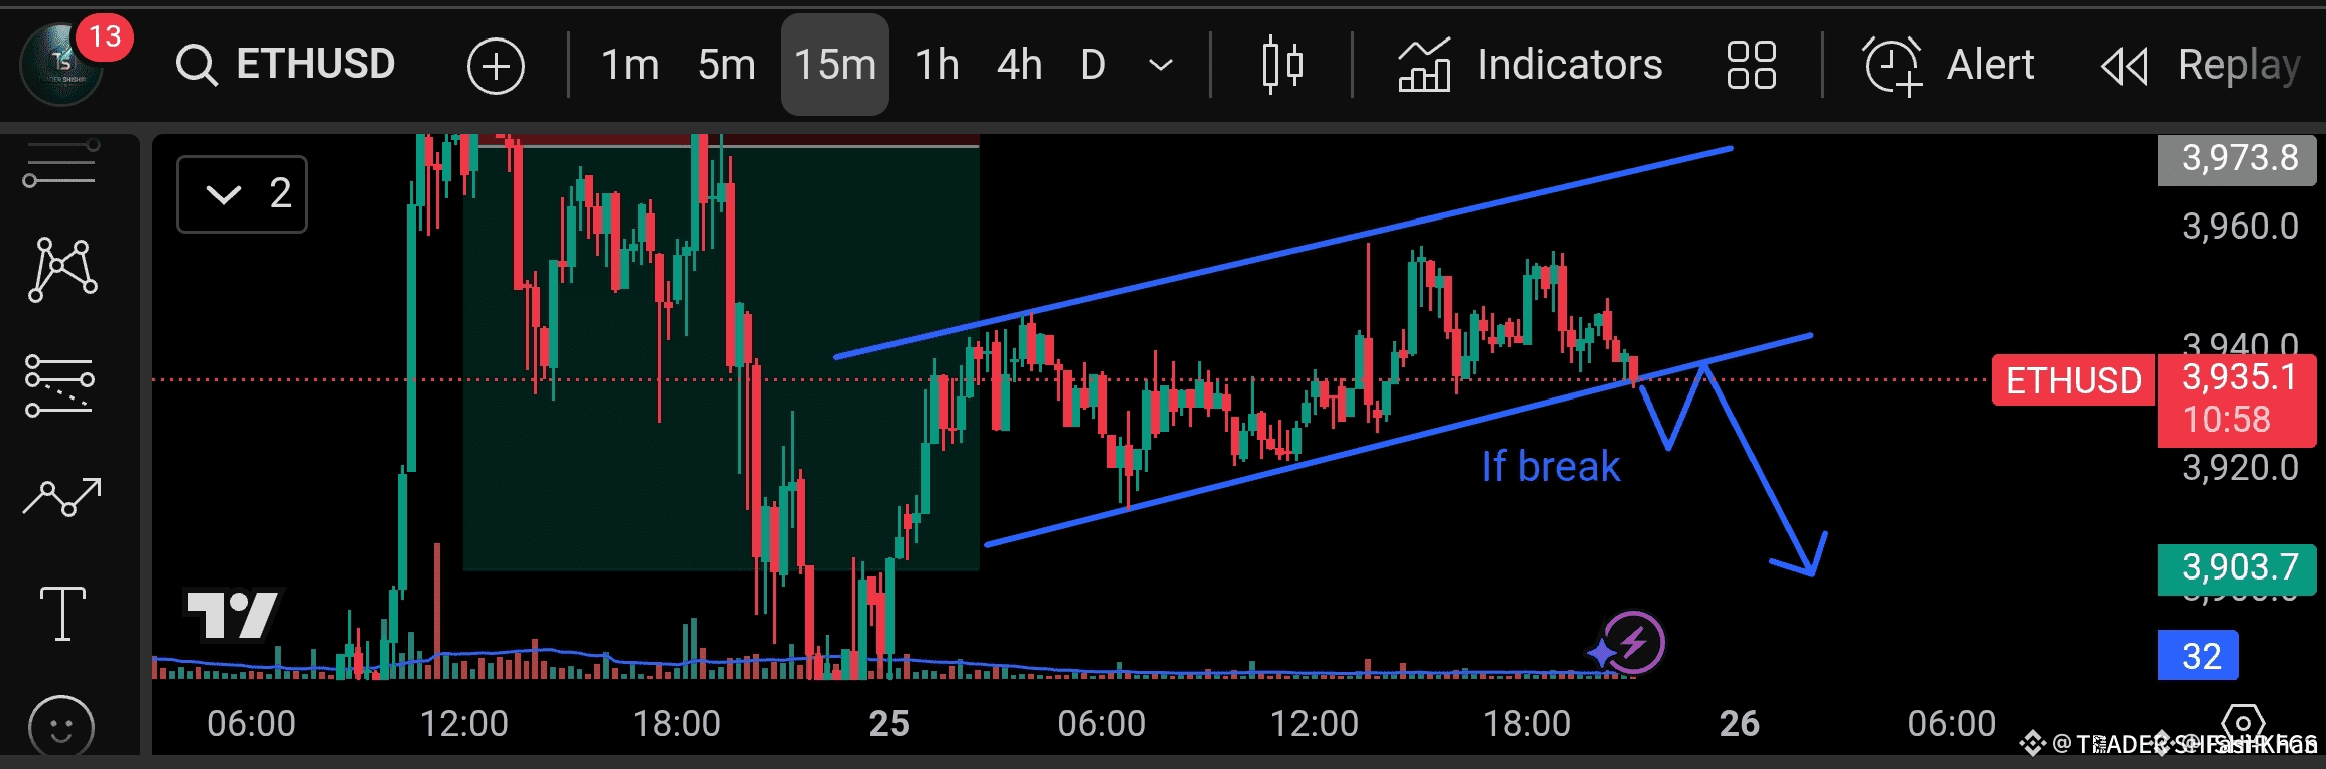
Timeframe: 15-Minute Chart (Intraday/Short-Term)
Fellow Binancians, let's zoom in on the short-term price action for Ethereum. The chart provided shows a formation that demands immediate attention for anyone trading on lower timeframes: a potential Rising Wedge pattern.
1. The image clearly illustrates two converging, upward-sloping trend lines, trapping the $ETH price action:
Higher Highs and Higher Lows: Price is still trending up, but the move is becoming compressed and less decisive as the trading range narrows.
Converging Lines: The upper resistance line and the lower support line are moving closer together. This signifies a loss of momentum and buyer exhaustion, a classic characteristic of the pattern.
The Bearish Bias: A Rising Wedge is overwhelmingly classified as a bearish reversal pattern. When it forms after an uptrend (as shown here), it signals that a downward breakout is highly probable.
2. The Trigger: The Breakdown Point
The chart itself highlights the critical condition: "If break" of the lower trendline.
Current Price: Approximately $3,935.1 (at the time of the chart).
Actionable Signal: The most critical event is a definitive candle close below the lower rising trendline. This breakdown confirms the pattern and is the signal to expect a sharp move down.
Potential Target: The technical target for a rising wedge breakout is typically the height of the wedge at its widest part, projected downwards from the break point. Visually, the target suggests a drop towards the previous support/consolidation zone, potentially near the $3,900 or even $3,850 psychological levels.
3. Why This Matters (The Market Psychology)
This pattern suggests that even though the price is moving up, the conviction of the buyers is fading.
Decreasing Momentum: Each subsequent high is less powerful than the last.
Trap for Longs: If the support breaks, traders who entered long positions in the upper half of the wedge will be quickly stopped out, creating a cascade of sell orders that fuels the rapid downside movement.
Trade Action Plan (NOT Financial Advice):
Wait for Confirmation: Do NOT preemptively short the market. Wait for a clear, confirmed close of a 15-minute candle below the bottom trendline of the wedge.
Entry: Consider a short entry on the confirmed break or a retest of the broken trendline (which then acts as new resistance).
Risk Management: Place your Stop-Loss above the most recent swing high within the wedge to manage risk effectively.
The Alternative (Bullish Invalidation):
If $ETH manages to break out and close above the upper trendline, the bearish pattern is invalidated, and we could see a continuation of the upward move toward new local highs. However, based on the classic interpretation of the Rising Wedge, the bias remains bearish.
Keep your eyes glued to that lower support line. The next few 15-minute candles could dictate the short-term direction for Ethereum!
#ETH #Ethereum #TechnicalAnalysis #TradingSignals #BinanceSquareFamily