
Bubblemaps, a blockchain analytics platform, has launched an innovative tool designed to simplify cryptocurrency transaction tracking and wallet relationship analysis through visual representations.
The platform uses interactive visuals, displaying wallets as bubbles whose sizes reflect token holdings and connections illustrating token transfers between addresses.
Traditional blockchain explorers typically present raw transactional data without visual context, complicating analysis and hindering efficient identification of suspicious activities.
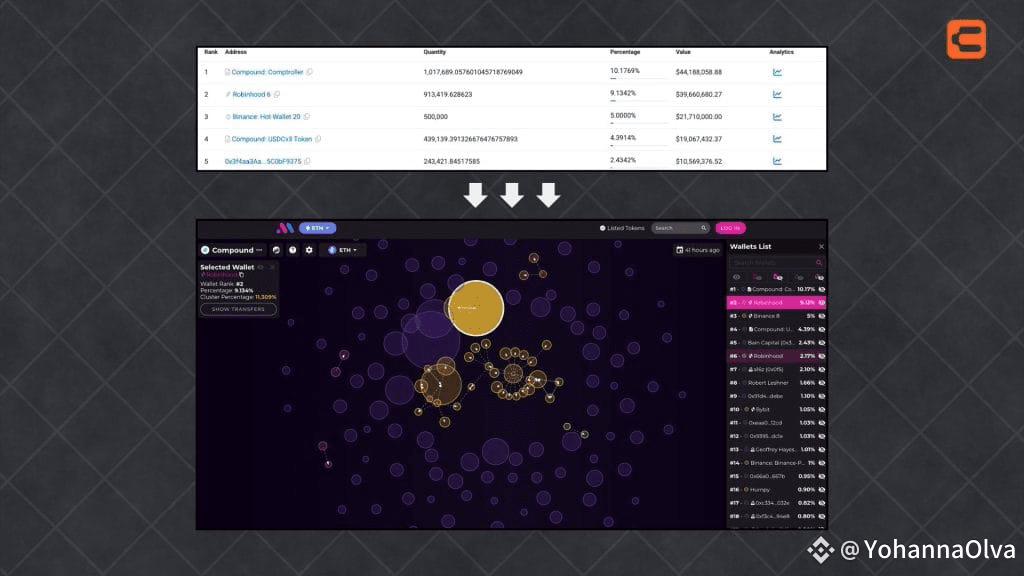
The visual mapping offered by Bubblemaps clearly delineates transactional patterns and connections among wallets. Each wallet is represented by a bubble proportionally sized to its token volume, with transfer activities represented through visual links.
Premium Features Track Profits and Top 1,000 Holders
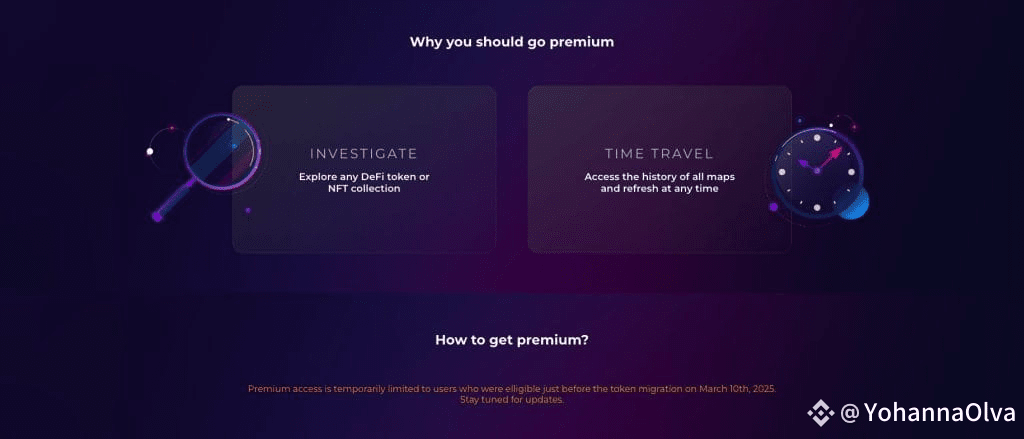
Advanced users have access to additional premium features, including:
Profit & Loss (P&L) Computation
Cross-chain Analytics
AI-driven Anomaly Detection
Top 1,000 Holder Visualization
The Profit & Loss (P&L) computation feature automatically calculates profits or losses from cryptocurrency transactions. Additionally, the cross-chain analytics feature allows users to track token movements across different blockchain networks. For example, if tokens are transferred from Ethereum to Binance Smart Chain, users can visualize and analyze these cross-chain movements.
The platform employs AI-driven anomaly detection to identify unusual or potentially fraudulent transaction behaviours. For instance, if a wallet suddenly transfers a large number of tokens to an unfamiliar address, Bubblemaps’ AI systems flag this activity as potentially suspicious, prompting users to review transactions for potential risks.
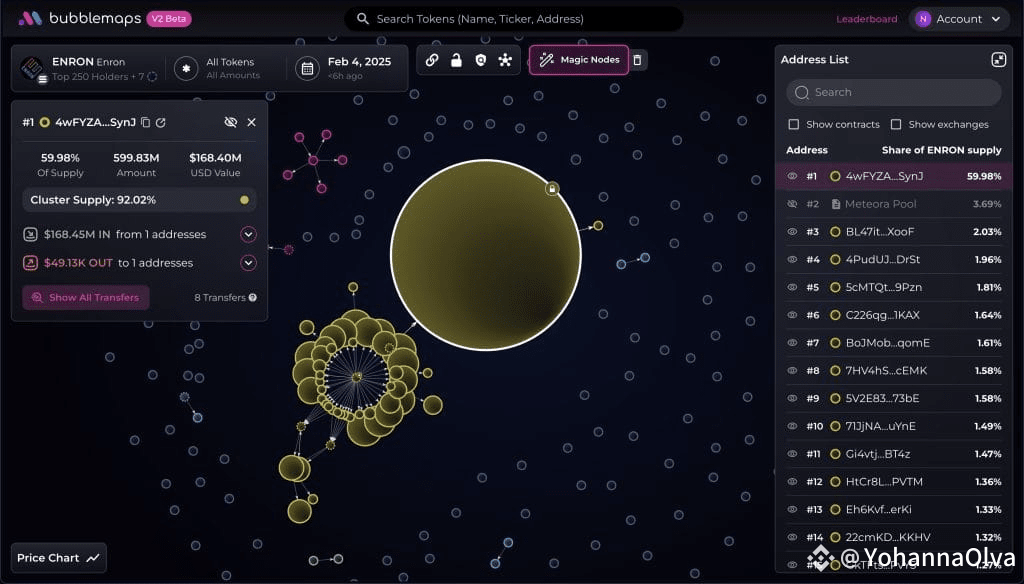
Bubblemaps provides detailed visualizations of the top 1,000 token holders. Users can quickly identify if a small number of wallets control a large portion of tokens, signalling potential risks of market manipulation or volatility.
Bubblemaps V2 Launch Overwhelms Platform with 200K+ Users
Although Bubblemaps recently released version 2 (V2), the platform experienced over-expected user adoption, reaching over 200,000 users within three days of launch, leading to the implementation of controlled reopening measures, including daily access limits, to ensure platform stability and performance.
New Feature of V2DescriptionMagic NodesIdentifies hidden clusters of interconnected wallet addresses, revealing deceptive token distributions and covert market manipulation attempts.Time-Travel Historical AnalysisAllows users to view and analyze past blockchain token distributions, providing insights into the evolution of wallet ownership and token transfers over time.Custom Address TrackingOffers users the ability to manually input and track specific wallet addresses, allowing targeted analysis of wallets or groups of interest.
@Bubblemaps.io #Bubblemaps $BMT