

Price Levels and Key Zones:
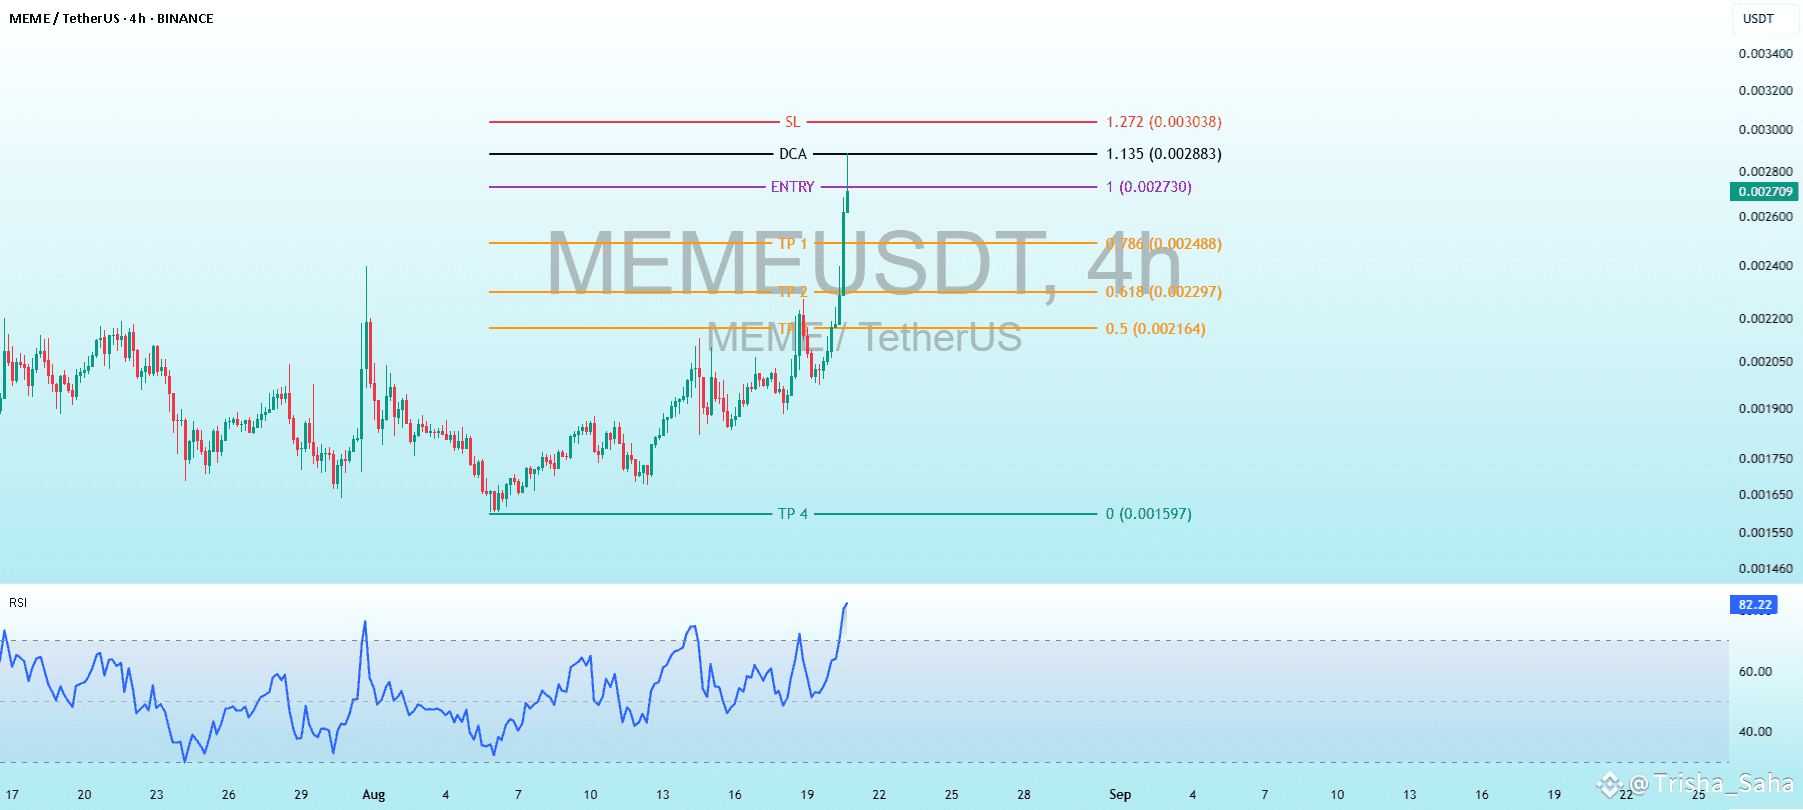
Entry: 1.00 (0.002730 USDT) - Identified as a potential entry point for a trade.
DCA (Dollar Cost Averaging): 1.135 (0.002883 USDT) - A level for averaging the cost if the price drops.
SL (Stop Loss): 1.272 (0.003036 USDT) - A stop-loss level to protect the investment.
TP (Take Profit) Levels:TP1: 0.476 (0.002448 USDT)
TP2: 0.618 (0.002297 USDT)
TP3: 0.5 (0.002164 USDT)
TP4: 0 (0.001597 USDT) - An unusually low target, possibly a typo or a theoretical minimum.
Trend and Price Movements:
The chart shows a sharp upward spike around August 7-10, reaching a local peak.
Following this, there has been a gradual decline with minor fluctuations, stabilizing near the entry level (1.00).
A recent uptick is visible, suggesting potential momentum as of the latest data point at 6:36 PM CEST on August 20, 2025.
RSI (Relative Strength Index):
The RSI is currently at 82.39, indicating that MEME is in overbought territory (above 70), which may suggest a potential reversal or correction in the near future unless supported by strong buying pressure.
Observations:
The chart includes a trading strategy with defined entry, stop-loss, and take-profit levels, likely created by a user (AltcoinPioneers) using TradingView.
The price action shows volatility, typical of meme coins, with significant price swings.