
Date: Mon, Aug 18, 2025 | 09:10 AM GMT
The cryptocurrency market is under notable selling pressure as Ethereum (ETH) drops 6% on the day, sliding to $4,250 from its recent peak of $4,780. This decline has put pressure on most major altcoins.
Yet, despite the broader pullback, Polygon (POL) has managed to stay in the green, and its chart is now highlighting a harmonic formation that suggests further upside may be on the horizon.
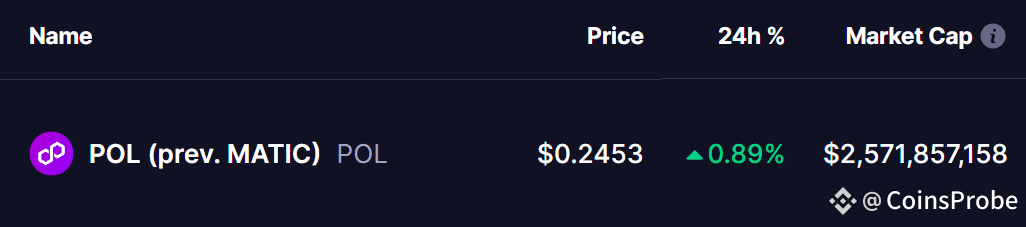
Source: Coinmarketca
Harmonic Pattern Hints at Potential Bounce
On the daily chart, $POL is forming a Bearish ABCD harmonic pattern — a structure that, while technically bearish, typically involves a strong bullish CD-leg rally before the final Potential Reversal Zone (PRZ) comes into play.
The move began with a rally from Point A near $0.1633 to Point B, followed by a pullback to Point C around $0.1898, where buyers re-entered the market. Since then, POL has rebounded and is currently hovering around $0.2448, with momentum suggesting that the CD leg is now unfolding.
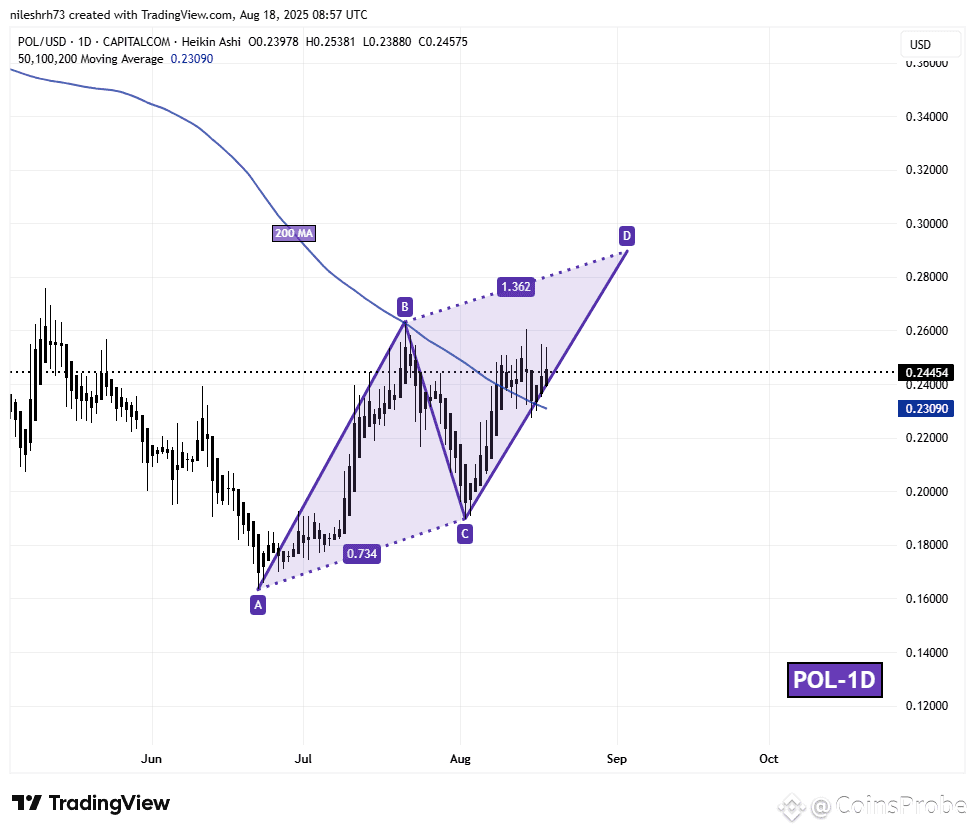
Polygon (POL) Daily Chart/Coinsprobe (Source: Tradingview)
The 1.36 Fibonacci extension of the BC leg projects Point D near $0.2896, marking a key upside target that traders will be watching closely.
What’s Next for POL?
If POL can sustain a move above the 200-day moving average ($0.2390), it could act as a launchpad toward the PRZ at $0.2896 — representing an upside potential of more than 18% from current levels.
Failure to hold above the 200-day MA, however, may slow the rally, bringing short-term consolidation back into play before any renewed push higher.
Disclaimer: This article is for informational purposes only and not financial advice. Always conduct your own research before investing in cryptocurrencies.

