In the pulsating heart of the cryptocurrency universe, where innovation meets speculation, Polkadot (DOT) shines as a beacon of interoperability, weaving together disparate blockchains into a seamless tapestry. As we stand in August 2025, DOT’s journey on Binance captivates traders and visionaries alike, promising a future where blockchains converse freely. But what does the market whisper about DOT’s price trajectory? This article embarks on a meticulous exploration of Polkadot’s technical landscape, weaving together chart patterns, on-chain signals, and ecosystem catalysts to forecast its path with clarity and creativity.
The Polkadot Vision: A Symphony of Chains
Polkadot, birthed by Ethereum co-founder Gavin Wood, is no ordinary cryptocurrency. It’s a layer-0 protocol, a maestro orchestrating a network of parachains—independent blockchains tethered to its central Relay Chain. This architecture empowers scalability, cross-chain communication, and customizable governance, making DOT the lifeblood of a decentralized Web3 future. With over 50% of its supply staked and a thriving ecosystem of projects like Moonbeam and Acala, Polkadot’s fundamentals pulse with potential. But can its price chart harmonize with this ambition?
Technical Analysis: Reading the Market’s Rhythm
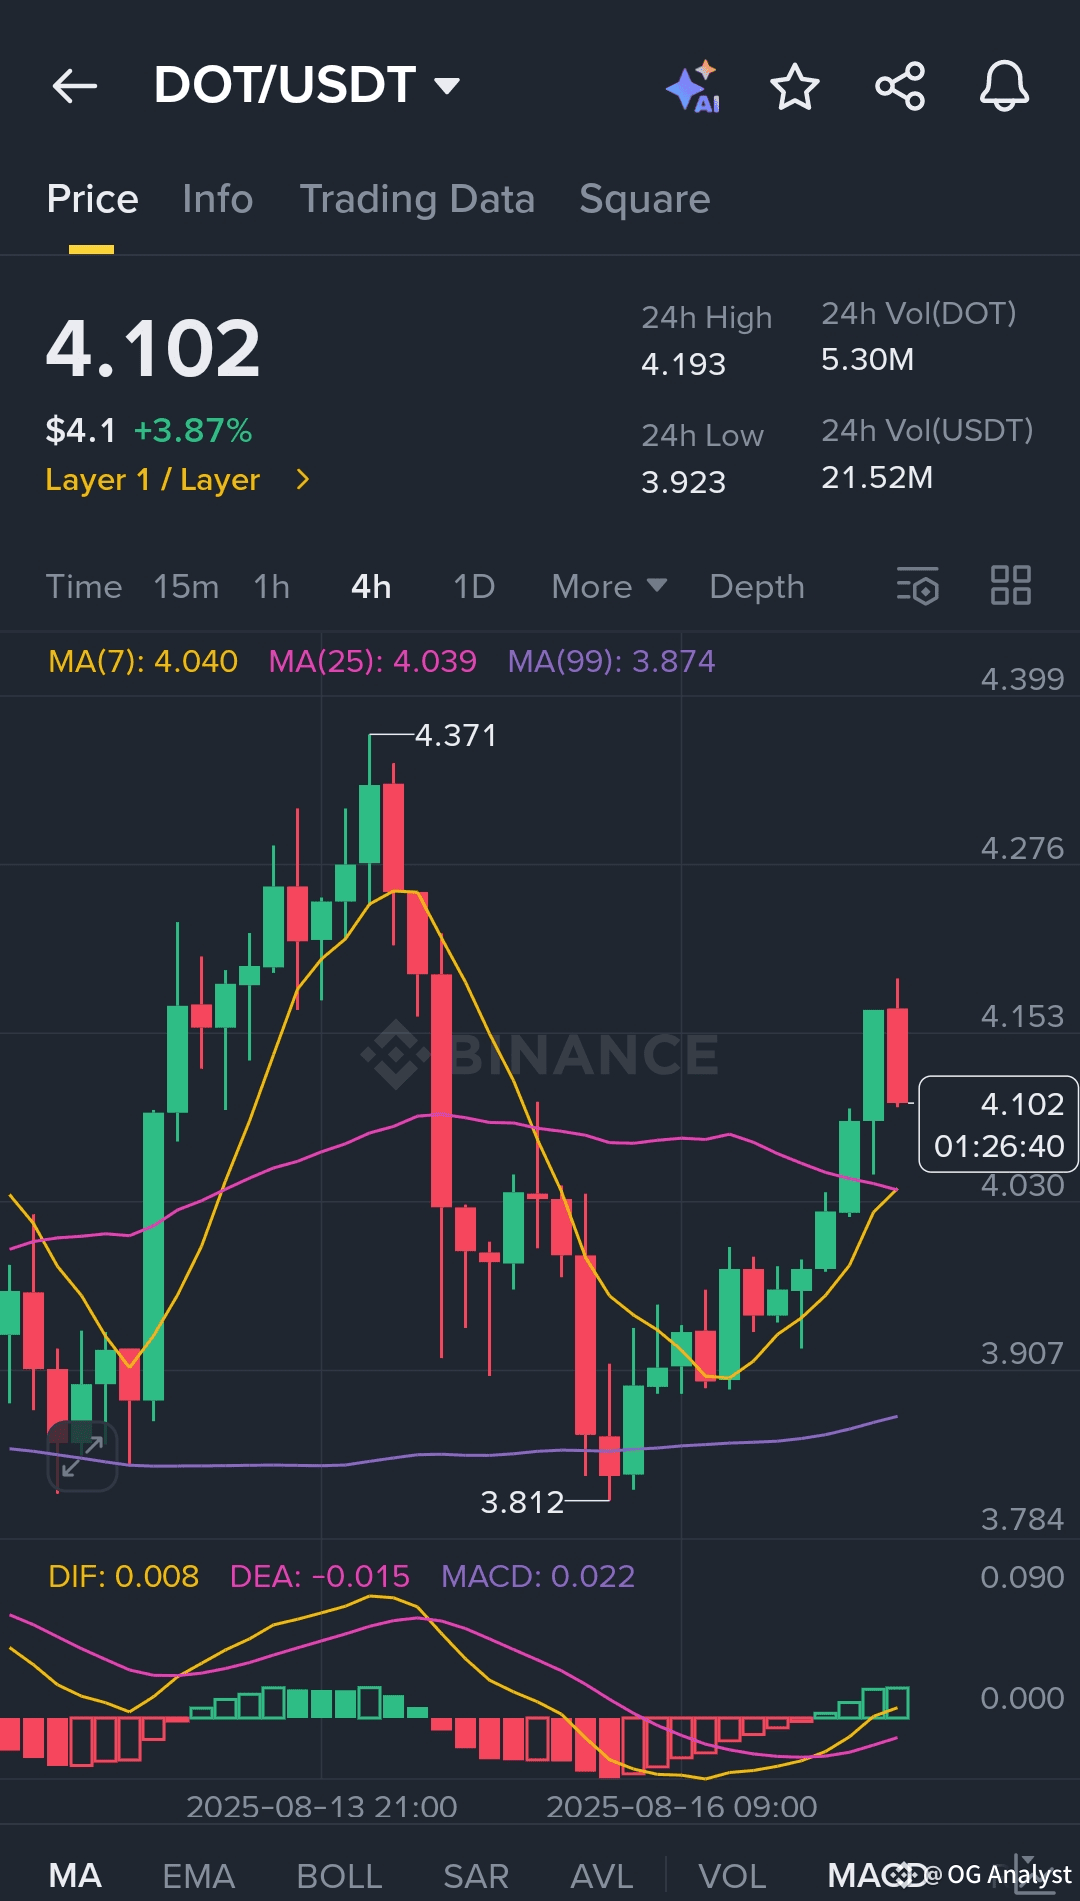
As of August 17, 2025, DOT trades around 3.95 USD on Binance, a far cry from its 2021 peak of 55 USD but showing flickers of resilience. Let’s dissect the technical indicators to uncover the market’s mood.
Price Patterns: A Canvas of Possibilities
DOT’s price action on Binance reveals a descending broadening wedge on the daily chart, a pattern often heralding a bullish reversal. This structure, marked by lower highs and lower lows with expanding volatility, suggests a tug-of-war between bears and bulls. The price hovers near a critical support zone at 3.83–4.00, a level that has held firm since late 2024. A breakout above the immediate resistance at 4.61 could propel DOT toward 5.35, aligning with the Fibonacci 23.6% retracement from its all-time high. Conversely, a breach below 3.83 risks a slide to 3.24, a pivotal swing low.
Moving Averages: The Market’s Pulse
The 50-day moving average (MA) at 4.90 looms above the current price, acting as a potential resistance. Meanwhile, the 200-day MA, sloping downward since June 2025, signals a weakened long-term trend. However, a recent bullish crossover on the 4-hour chart, where the 50-day MA edges above the 200-day MA, hints at short-term momentum. If DOT sustains above 4.30, it could challenge the 50-day MA, setting the stage for a rally toward 6.10.
Oscillators: Gauging the Tempo
The Relative Strength Index (RSI) sits at 44.43, teetering in neutral territory but shy of oversold levels, suggesting room for upward movement without immediate overbought concerns. The MACD histogram, however, lingers at -0.0739, reflecting subdued momentum. A bullish divergence—where price forms higher lows while RSI climbs—could signal an impending upswing, especially if trading volume spikes. The Average Directional Index (ADX) at 29.39 indicates a strengthening trend, while the Relative Volatility Index (RVI) at 64.78 underscores heightened market fluctuations, a trader’s playground for both opportunity and caution.
Volume and On-Balance Volume (OBV): The Crowd’s Chant
Trading volume on Binance, averaging 448 million USD daily, remains robust but lacks the explosive surges seen in past rallies. The OBV is flat, indicating balanced buying and selling pressure. A surge in volume accompanying a breakout above 4.61 would validate bullish sentiment, while declining volume could foreshadow a retreat to lower supports.
Fundamental Catalysts: The Winds of Change
Beyond the charts, Polkadot’s ecosystem hums with developments that could sway its price. The rollout of Polkadot 2.0 in August 2025 introduced elastic scaling and the Join-Accumulate Machine (JAM) protocol, enhancing parachain efficiency and Ethereum compatibility. These upgrades bolster Polkadot’s appeal to developers, potentially driving demand for DOT as a governance and staking token. The 5 million DOT Ecosystem Fund fuels innovation, with projects like Hydration amplifying DeFi and NFT use cases.
High staking rates—55% of DOT’s supply locked—curb sell pressure, creating scarcity that could ignite price surges if demand spikes. However, challenges loom: competition from Cosmos and Avalanche, regulatory scrutiny (notably ETF delays), and slower-than-expected parachain adoption could temper enthusiasm.
Price Predictions: Charting the Horizon
Blending technical signals with ecosystem dynamics, here’s a nuanced forecast for DOT’s price on Binance in 2025 and beyond:
Short-Term (Q3–Q4 2025): If DOT breaks above 4.61 with strong volume, it could target 5.35–6.10 by year-end, driven by Polkadot 2.0’s momentum. A bearish scenario, triggered by macroeconomic tightening or regulatory hurdles, might see DOT dip to 3.24–3.47.
Mid-Term (2026): Continued ecosystem growth and broader market recovery could push DOT to 10.40–15.60, with analysts citing Moonbeam’s traction and Web3 adoption as catalysts. A conservative low of 5.20 remains possible if altcoin sentiment falters.
Long-Term (2030): Bullish projections range from 52.65–78.98, fueled by Polkadot’s interoperability dominance and potential ETF approvals. Bearish estimates peg a floor at 26.33, assuming competitive pressures persist.
Risks and Opportunities: Balancing the Scales
Polkadot’s promise is undeniable, but the crypto market’s volatility demands caution. Regulatory uncertainties, particularly around ETF approvals, could stall momentum. Competition from rival interoperability protocols threatens market share. Yet, Polkadot’s technical prowess—143,000 transactions per second on Kusama—and zero Relay Chain downtime since 2020 underscore its reliability. Strategic partnerships, such as Harbour’s stablecoin payment integration with EU banks, could spark rallies if executed swiftly.
Conclusion: DOT’s Path to Greatness
Polkadot stands at a crossroads, its price a reflection of both market skepticism and untapped potential. The technical landscape hints at a brewing breakout, with supports holding firm and bullish patterns emerging. Coupled with Polkadot 2.0’s transformative upgrades and a robust staking ecosystem, DOT is poised to reclaim higher ground. Traders on Binance should watch the 4.61 resistance and 3.83 support as pivotal markers, while long-term holders may find solace in Polkadot’s vision of a connected blockchain future. Will DOT soar to new heights, or will it linger in the shadows? The charts and fundamentals suggest a crescendo is near—tune in, and don’t miss the beat.