
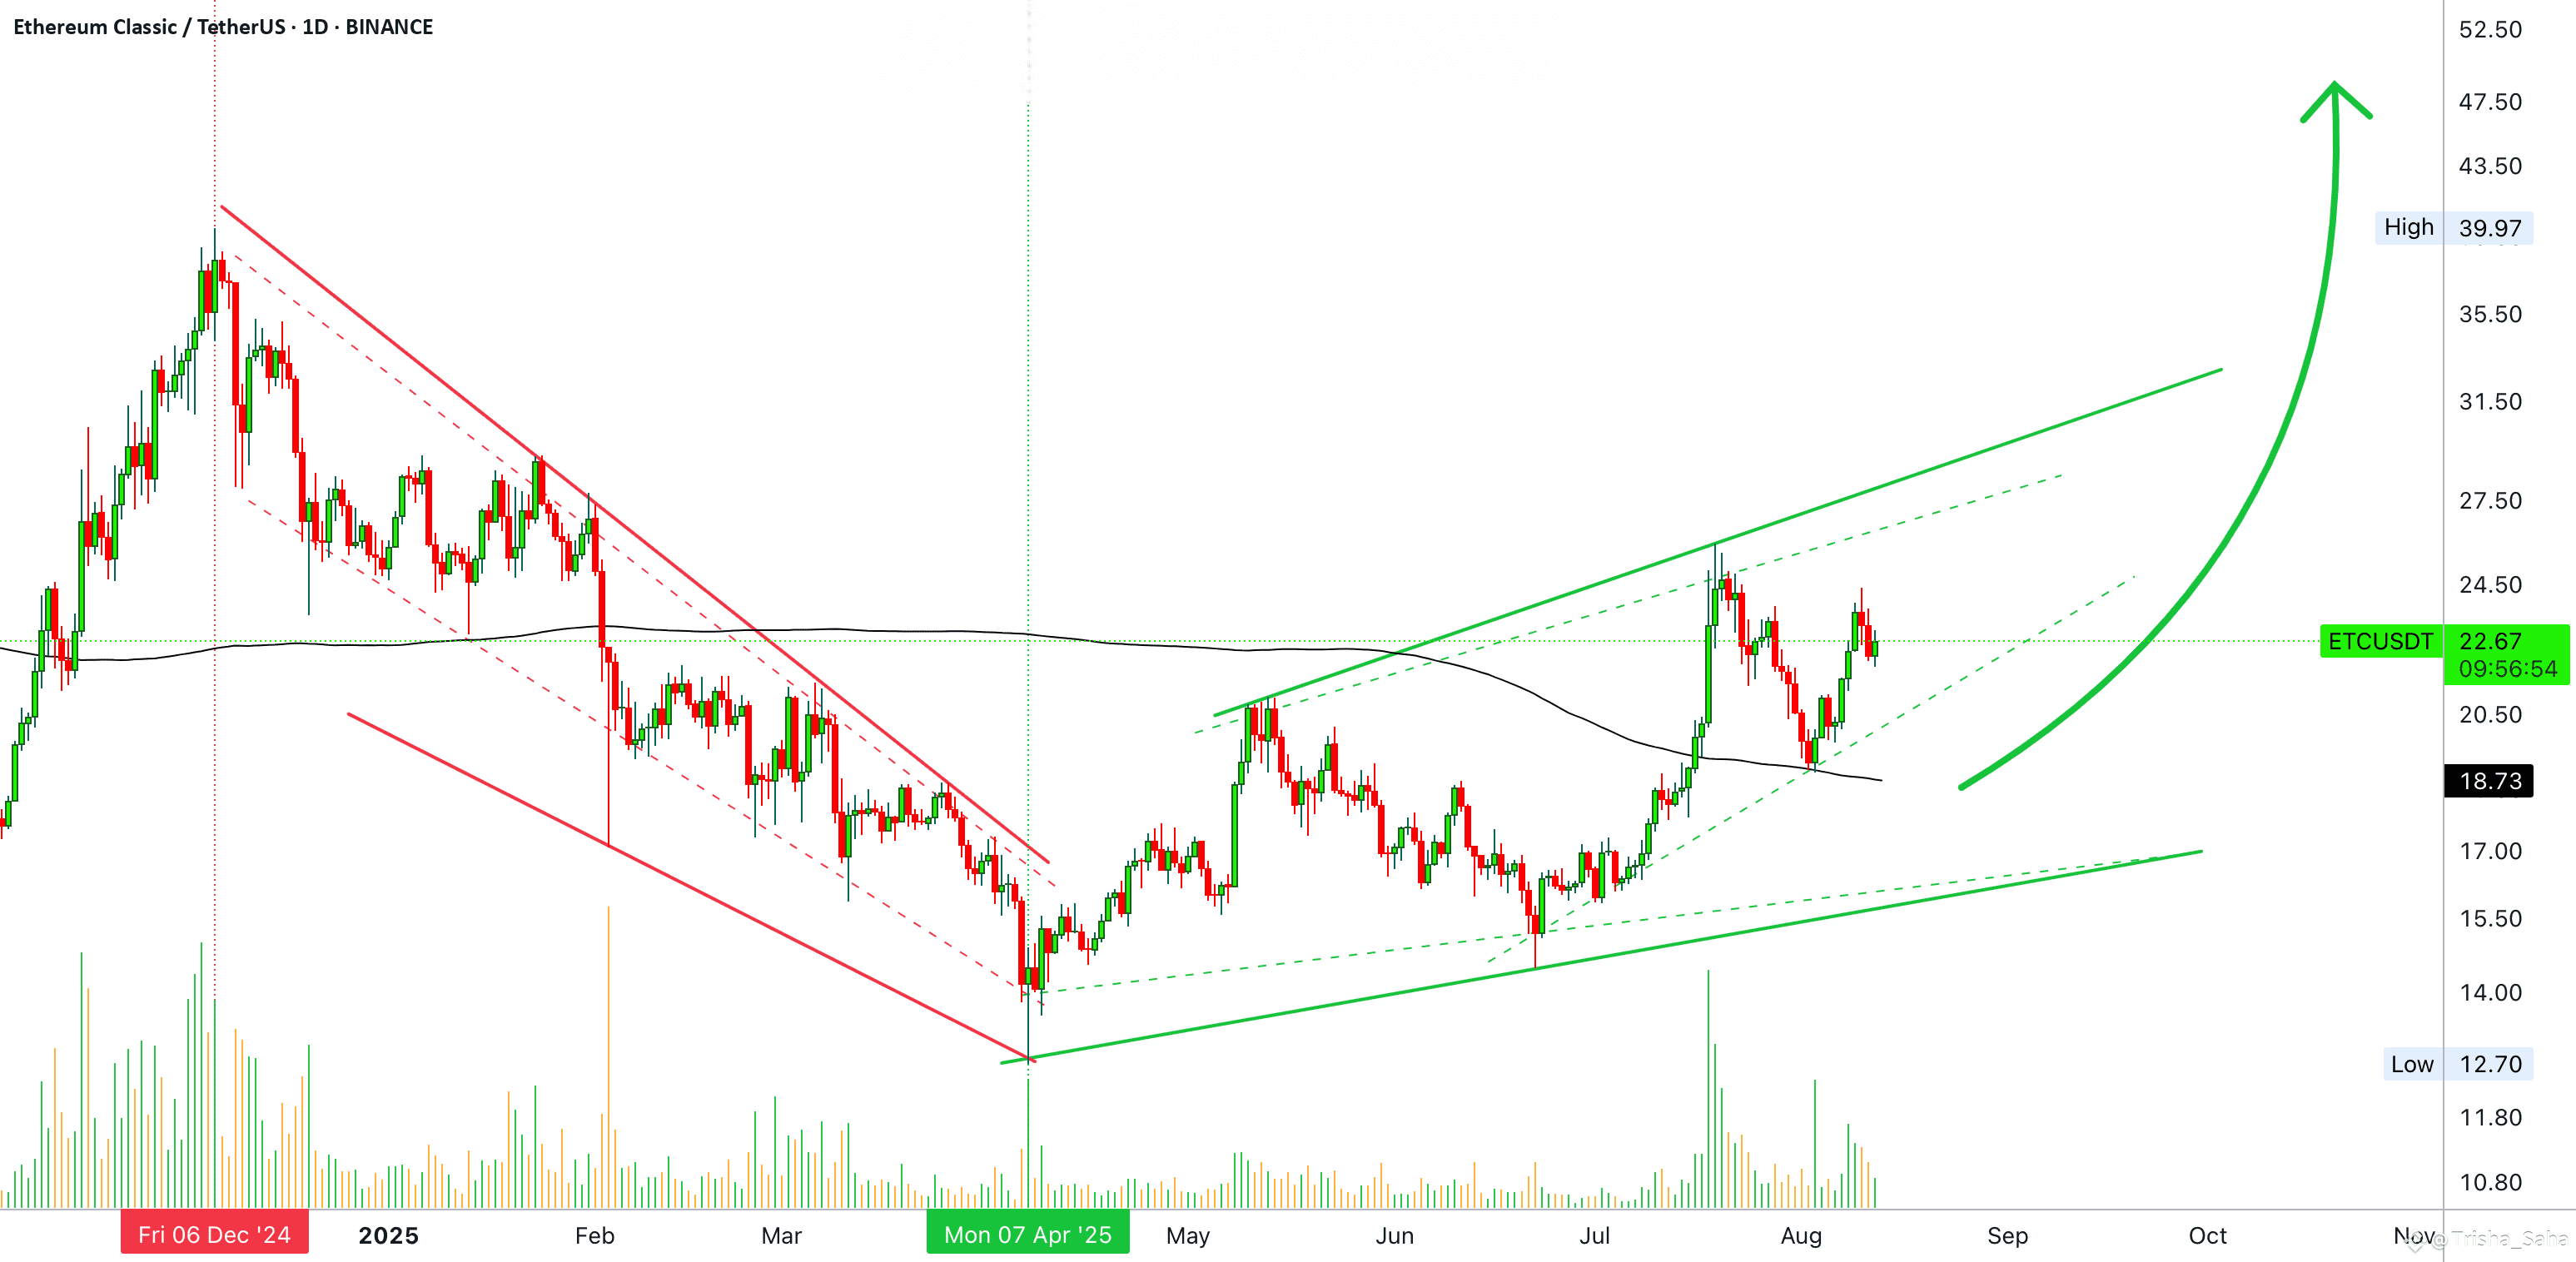
Ethereum Classic is already on the other side, as you can see from this chart. 7-April 2025 was a turning point.
The correction developed from a high point in December 2024 and ended early April 2025. The day this correction ended, Ethereum Classic entered a new bullish cycle. This new bullish cycle as an uptrend is only confirmed after the chart produces a series of higher highs and higher lows, rising prices. This sequence is already present. We have two main lows and two main highs.
Ethereum Classic is already growing, it has been growing for months, and will continue to grow long-term.
This is a daily timeframe. I will do a new publication where we look at ETC long-term and project some new and updated 2025 bull market targets. We looked at ETC dozens of times in the past since 2022 and now we are ready to look at the numbers again.
The numbers will be the same as I used long-term numbers back then but it is good to refresh our minds.
Patience is key. Continue to hold strong.
Market conditions are great for this pair, ETCUSDT; notice the rising volume at the bottom of the chart. Notice MA200 as well.
If you go back to 2024, when ETCUSDT moved above MA200 with rising volume, a major high showed up. This time it is better though. There was a full flush and ETC is trading above MA200 coming from a low point. This gives further strength to the bullish case, because it makes it clear that there is still plenty of room left available for growth.
The bullish phase can last for months. The bull run phase alone can last 1-2 months. The entire period 4-6 months. If we count the build up phase, we have a duration of 8-12 months for the full completion of a bull market bullish wave.
Namaste.
#DeFiGetsGraded #CPIWatch #BTCOvertakesAmazon #BTCReclaims120K #ETHTreasuryStrategy