
Kaspa price is still stuck in a tight range after losing some of that early August momentum. Right now, price action is looking a bit hesitant, bulls just can’t seem to push past that stubborn resistance, and while some indicators are leaning slightly bullish, most are sitting neutral.
After getting knocked back from $0.096 last week, KAS has drifted down to hover just above the $0.090 mark. Buyers are holding that line for now, but it’s clear this level is under pressure.
Let’s break down today’s setup.
What We Got Right Yesterday
In yesterday’s prediction, we pointed out that $0.10 was the big breakout level for Kaspa. We said if it couldn’t get through, the price would probably bounce around between $0.085 and $0.10.
That’s exactly what happened. KAS price never closed above $0.10, and it’s been stuck in that sideways range ever since. Today’s lows are brushing up against the $0.089–$0.090 zone, which is getting dangerously close to that lower boundary we warned about.
We also said a drop under $0.090 could put $0.085 in play, and right now, that’s still on the table.
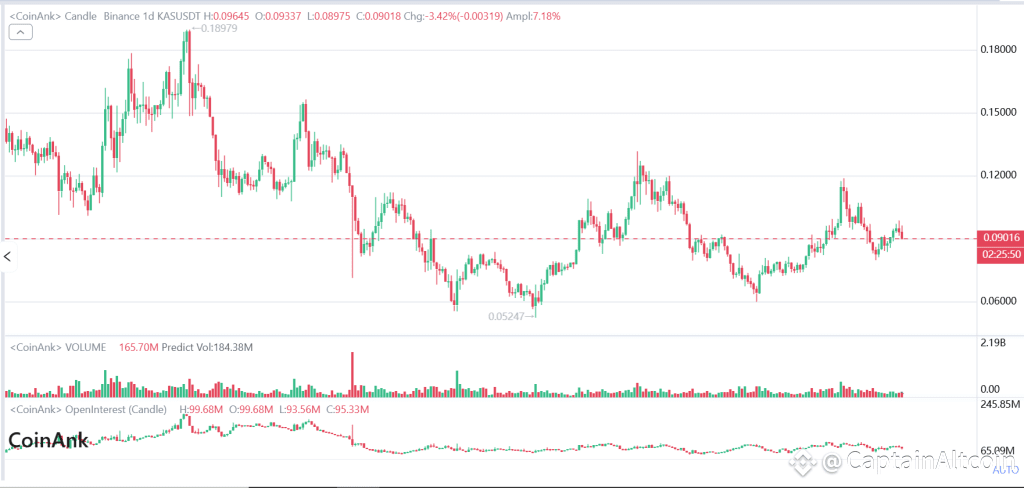
Kaspa Daily Overview (August 12)
Current Price: $0.09012
24h Change: -3.42%
Volume: 165.7M (predicted 184.3M)
The $0.090 level is acting like a pivot point right now. Sellers keep KAS price locked below $0.096, and buyers are digging in at support. The overall uptrend from $0.052 is still alive, but momentum has slowed down a lot.
What the Kaspa Chart Is Showing
The daily KAS chart makes it clear: $0.096–$0.098 is a wall. Every rally over the past week has hit it and bounced back.
On the flip side, $0.090 is still holding as support. Lose it, and we could be heading for $0.077–$0.085. Break above $0.096, and the next stops are $0.118–$0.120.
 Source: CoinAnk
Volume’s quieter than it was during past breakouts, which tells me traders are waiting for a real move before committing.
Daily Technical Indicators
Indicator Value Signal RSI (14) 50.78 Pretty balanced, no strong momentum either way ADX (14) 30.20 Trend strength leans slightly bullish MACD (12,26) 0.002 Early signs of bullish momentum CCI (14) 42.09 Neutral zone Ultimate Oscillator 50.92 Balanced across timeframes Bull/Bear Power (13) 0.0013 A tiny edge for the bulls
Read also: Kaspa Price Enters a Decision Zone as Exchange Supply Shrinks – Here’s What the KAS Chart Reveals
KAS Price Scenarios
Bullish:
Close above $0.10 and we could see $0.105-$0.110, maybe even $0.118-$0.120 with enough volume.
Neutral:
Keep failing at $0.10 and KAS price probably stays stuck between $0.085 and $0.10.
Bearish:
Drop under $0.087 and $0.084-$0.085 becomes the target, with $0.080 not far behind if selling ramps up.
Bottom Line
Kaspa price is trading right at a make-or-break level. Get above $0.096–$0.10, and bulls have room to run. Lose $0.090, and the chart starts tilting bearish. Until one of those breaks, it’s just a waiting game for the next big move.
Subscribe to our YouTube channel for daily crypto updates, market insights, and expert analysis.
The post Kaspa (KAS) Price Prediction for Today (August 12) appeared first on CaptainAltcoin.
