
Kaspa price is holding up well above short-term support after bouncing off its early August lows. The price structure has stayed bullish since late June, with a series of higher lows backed by an ascending trendline. The 30-period EMA is still pointing upward, keeping the bias positive, but that $0.10 resistance hasn’t been cracked yet.
Let’s take a closer look at today’s setup.
What We Got Right Yesterday
Yesterday, we highlighted $0.10 as the breakout level to watch and $0.087 as the main support to hold.
So far, Kaspa price has stayed above the EMA at $0.094 and kept its bullish structure intact. As expected, buyers stepped in above $0.094, but momentum has cooled as price hovers near the $0.098–$0.10 zone.
Kaspa Daily Overview (August 11)
Current Price: $0.0946
24h Change: -0.84%
4H RSI (14): 52.25
Volume: Steady, no major surges
Right now, KAS price is trading in a tight range between $0.094 and $0.098. The ascending trendline from late June is still guiding the move, with $0.085–$0.087 acting as strong support underneath.
What the Kaspa Chart Is Showing
On the 4H chart, Kaspa is still showing a healthy uptrend, with multiple Break of Structure (BOS) points marking its climb. After topping at $0.122 in mid-July, the price pulled back to the trendline before recovering.
The next big test is the $0.098–$0.10 area. Breaking through could open the way to $0.105–$0.110, while another rejection might see price drift back toward $0.090 or even $0.085–$0.087.
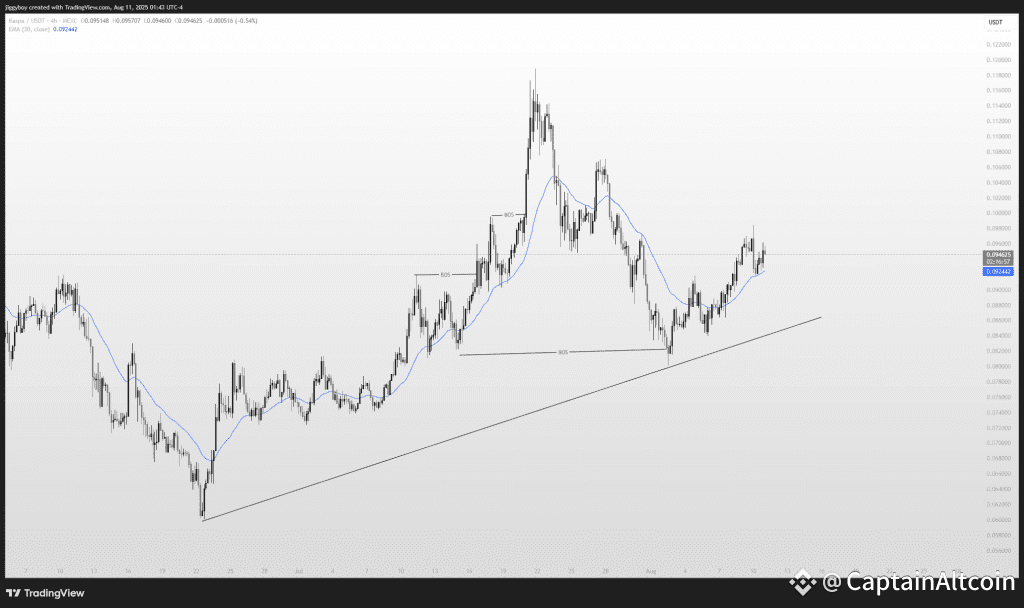 Image Source: TradingView.com Technical Indicators (Hourly Timeframe) Indicator Value Signal RSI (14) 52.25 Neutral momentum ADX (14) 26.05 Trend strength building MACD (12,26) 0 Balanced momentum CCI (14) 68.16 Slight bullish bias ROC 1.307 Positive short-term move Bull/Bear Power (13) 0.0016 Small bullish edge
Overall, the hourly indicators lean slightly bullish. The trend is picking up, but RSI and MACD show it’s not overstretched.
Kaspa Price Prediction Scenarios
Bullish:
If Kaspa can close strongly above $0.10, it would be a strong indication that the buyers are gaining control.That could push Kaspa up to around $0.105–$0.110 in the near term. If buyers keep the pressure on and trading volume increases, the rally might even stretch to $0.112–$0.120.. That would position the market in place to test the mid-July highs.
Neutral:
If $0.10 is still a ceiling, the KAS price could stay within a range pattern. If $0.10 keeps holding as resistance, the price would probably move sideways between $0.085 and $0.10 for a bit. This kind of range usually means traders are waiting for something bigger to happen before committing in either direction.
Read Also: Lido DAO (LDO) Short-Term Price Outlook For August
Bearish:
When Kaspa falls below $0.087, sellers can swoop in and drive it down to $0.084–$0.085 in a matter of minutes. Breaking that level may also trigger the decline to $0.080, which was a significant level back in June. Such a drop would break the trendline support and could change the short-term bias to the downside.
Wrapping Up
Kaspa price action is still going in the direction of higher price action, yet $0.10 is the clear hurdle to watch. For now, as long as Kaspa stays above the $0.094 EMA and the $0.085–$0.087 trendline, the advantage is still with the bulls. A close above $0.10 could shift momentum higher, while a drop under $0.087 would likely point to a deeper pullback.
Subscribe to our YouTube channel for daily crypto updates, market insights, and expert analysis.
The post Kaspa (KAS) Price Prediction for Today (August 11) appeared first on CaptainAltcoin.
