
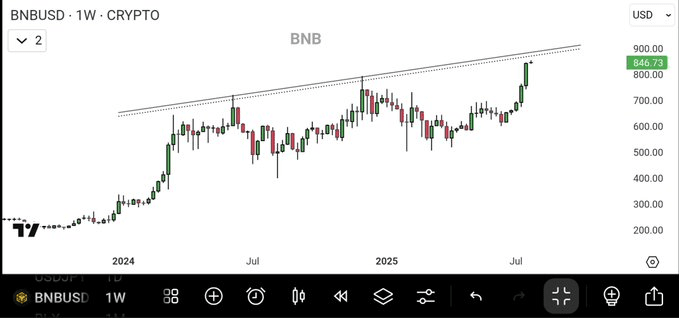
BNB touched $846 this week and now meets a 2-year trendline which blocked gains several times before.
If the trendline flips into support then a fast move to $1000 may happen as bulls take full control.
Strong weekly candles suggest BNB may push higher but past rejections from this level make traders alert.
Binance Coin (BNB) is currently testing a long-standing resistance trendline around the $846 price level, raising investor caution. The weekly chart indicates strong bullish momentum, but potential rejection looms at this crucial range. Analysts suggest a pullback may occur unless this level flips into a support zone. If confirmed, a break above this trendline could open the door to $1000.
 Source: X Weekly Chart Signals Caution Amid Strong Rally
The weekly BNB/USDT chart shows a steady uptrend that began in early 2024 and has accelerated sharply in recent weeks. Price action now touches a key resistance trendline that has acted as a ceiling since late 2023. Current trading levels near $846.73 represent a new all-time high for the token.
The trendline resistance is formed by two prior peaks, each met with sell-offs, suggesting it may again trigger profit-taking. In similar past instances, BNB retreated sharply after approaching this sloping ceiling, confirming it as a technically barrier.
Yet unlike earlier attempts, the present rally is supported by consecutive strong green weekly candles. The trend implies buyers have taken control of the market as price pushes into untested zones. Weekly volume has also shown growth, confirming strong participation.
Traders Eye Flip to Support Before $1000 Push
Anup Dhungana, a crypto analyst, noted the resistance with caution. He said that while BNB looks strong, this trendline may cause a pullback. In his words, “Once flipped to support, $1000 is on the table.” This suggests that bulls are monitoring the zone carefully.
A successful breakout and hold above the $850 zone could shift market structure significantly. Resistance turning into support would be seen as a bullish continuation signal. Such a shift may attract new inflows, likely targeting the psychological $1000 mark.
However, failure to clear the trendline might bring consolidation or a short-term reversal. Historical behavior shows that the $750–$850 range can be volatile and unpredictable. Bulls must maintain control and avoid forming a double top structure at this level.
Traders have begun adjusting their positions in anticipation of the move. Some are scaling out at current highs, while others are waiting for confirmation above $850. Market confidence appears tied to how this level resolves in the coming sessions.
Will Resistance Hold or Fuel the Next Breakout?
BNB’s strong move above $800 this week has stirred debate about whether this surge is sustainable or nearing exhaustion. The price now sits just beneath an ascending resistance that has been respected for over a year. This setup raises a key question: will the trendline reject or support the next move?
With BNB trading at $846.73 at press time, momentum appears strong, yet short-term traders remain cautious. The market now watches closely to see if a breakout occurs on volume or if a bearish wick forms. As of July 28, 2025, this remains the token’s highest weekly close ever.
Technical watchers on TradingView point to previous reactions at this level as precedent for caution. Both failed attempts in late 2024 and early 2025 ended with bearish reversals. If history repeats, the $850 range may mark another local top.
Yet sentiment across Binance and other crypto exchanges has tilted bullish in recent weeks. On July 23, Dhungana highlighted that BNB had already hit a new record high above $800. The strength in this rally gives weight to the possibility of a breakout. All eyes now remain fixed on this resistance point as the market waits for confirmation.
