

Strategy: Triangle Breakout + Wave Cycle Analysis
🔍 Technical Overview:
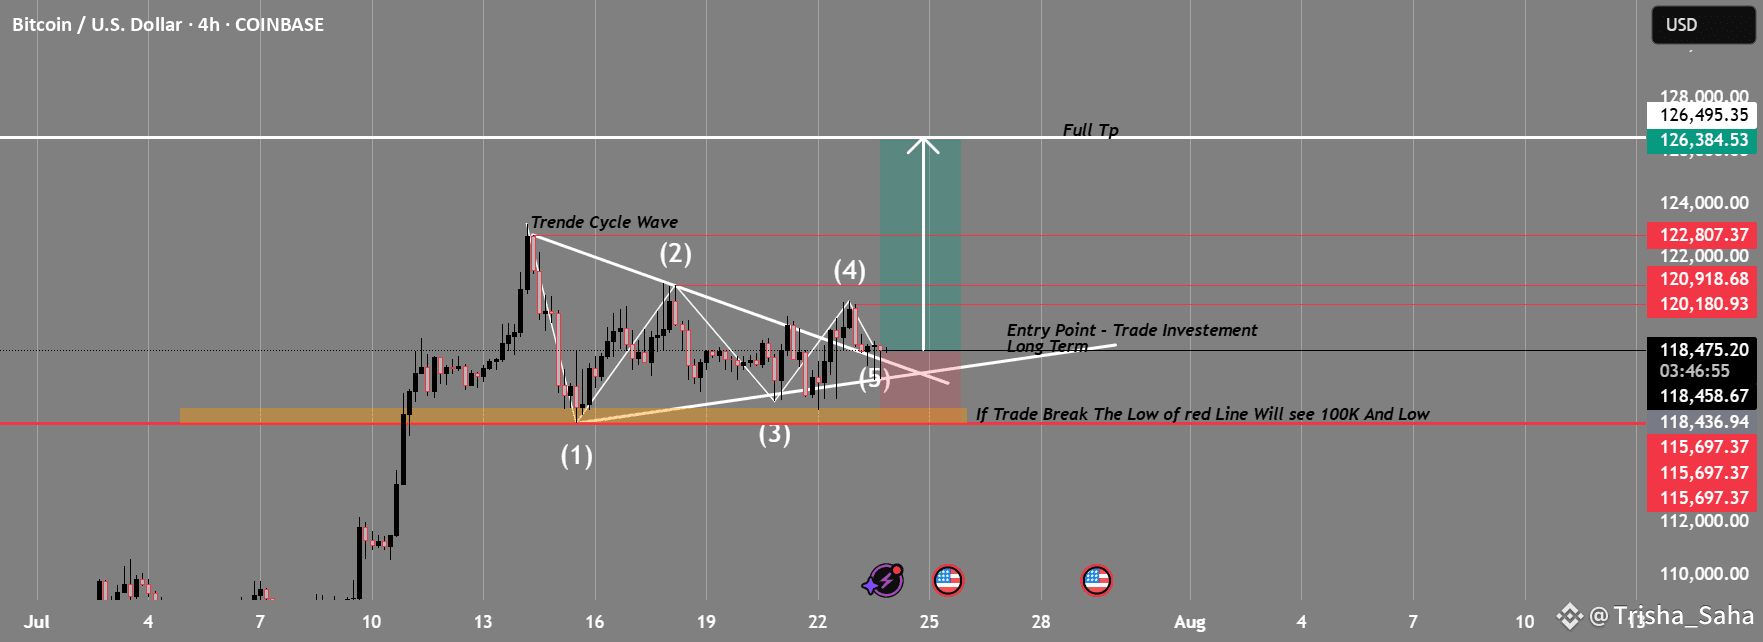
BTC is currently compressing within a symmetrical triangle pattern after completing a 5-wave cycle, suggesting a potential breakout is near. This structure indicates indecision — but also builds up momentum for a major move.
🔹 Wave Analysis: Complete cycle (1-5) within triangle
🔹 Support Zone: 115,697 (critical level — demand zone)
🔹 Resistance Breakout Target: 127,594 (measured move from triangle breakout)
🔹 Entry Point: Confirmed breakout above the triangle resistance (~118,500)
🔹 Invalidation: Strong 4H close below 115,697 = setup invalid
🔹 Risk/Reward: Favorable — breakout above resistance could trigger a strong bullish wave
🟢 Bullish Plan:
Entry: Break + Retest of upper trendline (~118,500)
Stop Loss: Below 115,697
Target 1: 122,800
Target 2: 126,384
Full TP: 127,594
🔴 Bearish Warning:
⚠️ “If price breaks the red support zone (115,697), BTC could drop sharply — possibly toward the 100K level and beyond.”
— a key invalidation level to monitor closely.
🧠 Conclusion:
This is a classic consolidation-to-breakout setup. Monitor volume and breakout confirmation before entering. If bullish momentum holds, this swing trade has great long-term potential.
💬 What do you think? Will BTC break bullish or drop to 100K? Drop your thoughts 👇
📌 Follow for real-time updates and future chart ideas!
#BTRPreTGE #CryptoClarityAct #BNBBreaksATH #TrumpBitcoinEmpire #BTCvsETH