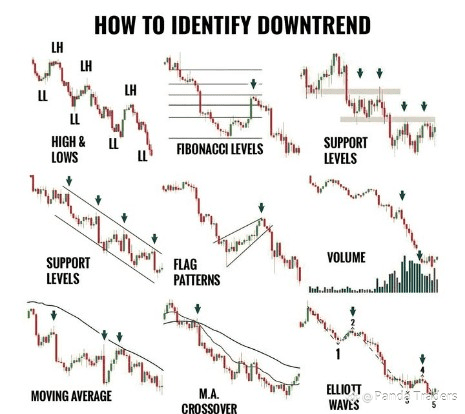
Identifying a downtrend early can help you avoid major losses and even catch profitable short opportunities. Here’s a visual breakdown of how smart traders recognize downtrends using reliable price action techniques:
🔻 1. Lower Highs & Lower Lows (LH & LL)
A classic sign. If price forms consistently lower highs and lower lows, it’s the market screaming: Downtrend active!
🔻 2. Fibonacci Rejections
In a bearish trend, price often retraces to Fibonacci levels (like 0.5 or 0.618) and then gets rejected hard. That’s a sell signal!
🔻 3. Broken Support Becomes Resistance
Once price breaks below a key support level and fails to reclaim it, that support turns into resistance. Watch how price respects it on the way down.
🔻 4. Bearish Flag Patterns
After a sharp drop, you might see a small upward channel (flag). Once broken, it often leads to another leg down.
🔻 5. Volume Confirmation
During the dumps, volume increases — red candles get louder. That’s institutions and whales driving the trend, not just small traders.
🔻 6. Moving Averages (MA)
If price is consistently below the 50 EMA or 200 EMA, and they are sloping downward, it reinforces bearish momentum.
🔻 7. MA Crossovers
When a shorter EMA (like 20 EMA) crosses below a longer EMA (like 50 EMA), it's called a bearish crossover. Many traders use this as a confirmation.
🔻 8. Elliott Wave Breakdown
If you're seeing impulsive moves down with smaller pullbacks up (Wave 1 to Wave 5), this structure often completes a major bearish wave pattern
Never rely on just one signal. Use a combination like LH-LL structure + volume spike + MA crossover — for higher