
Solana (SOL) has surged nearly 25% over the past week, riding the momentum of a broader crypto market rally that has reignited bullish sentiment across major altcoins.
Now trading at price levels last seen in February, SOL is attracting renewed interest from traders and investors. However, on-chain data suggests not everyone is convinced the rally will last. What does this mean for the altcoin in the short term?
Solana Traders Split Between Hope and Caution
According to Glassnode, SOL’s Net Unrealized Profit/Loss (NUPL) metric places the market in the “Optimism–Anxiety” zone.
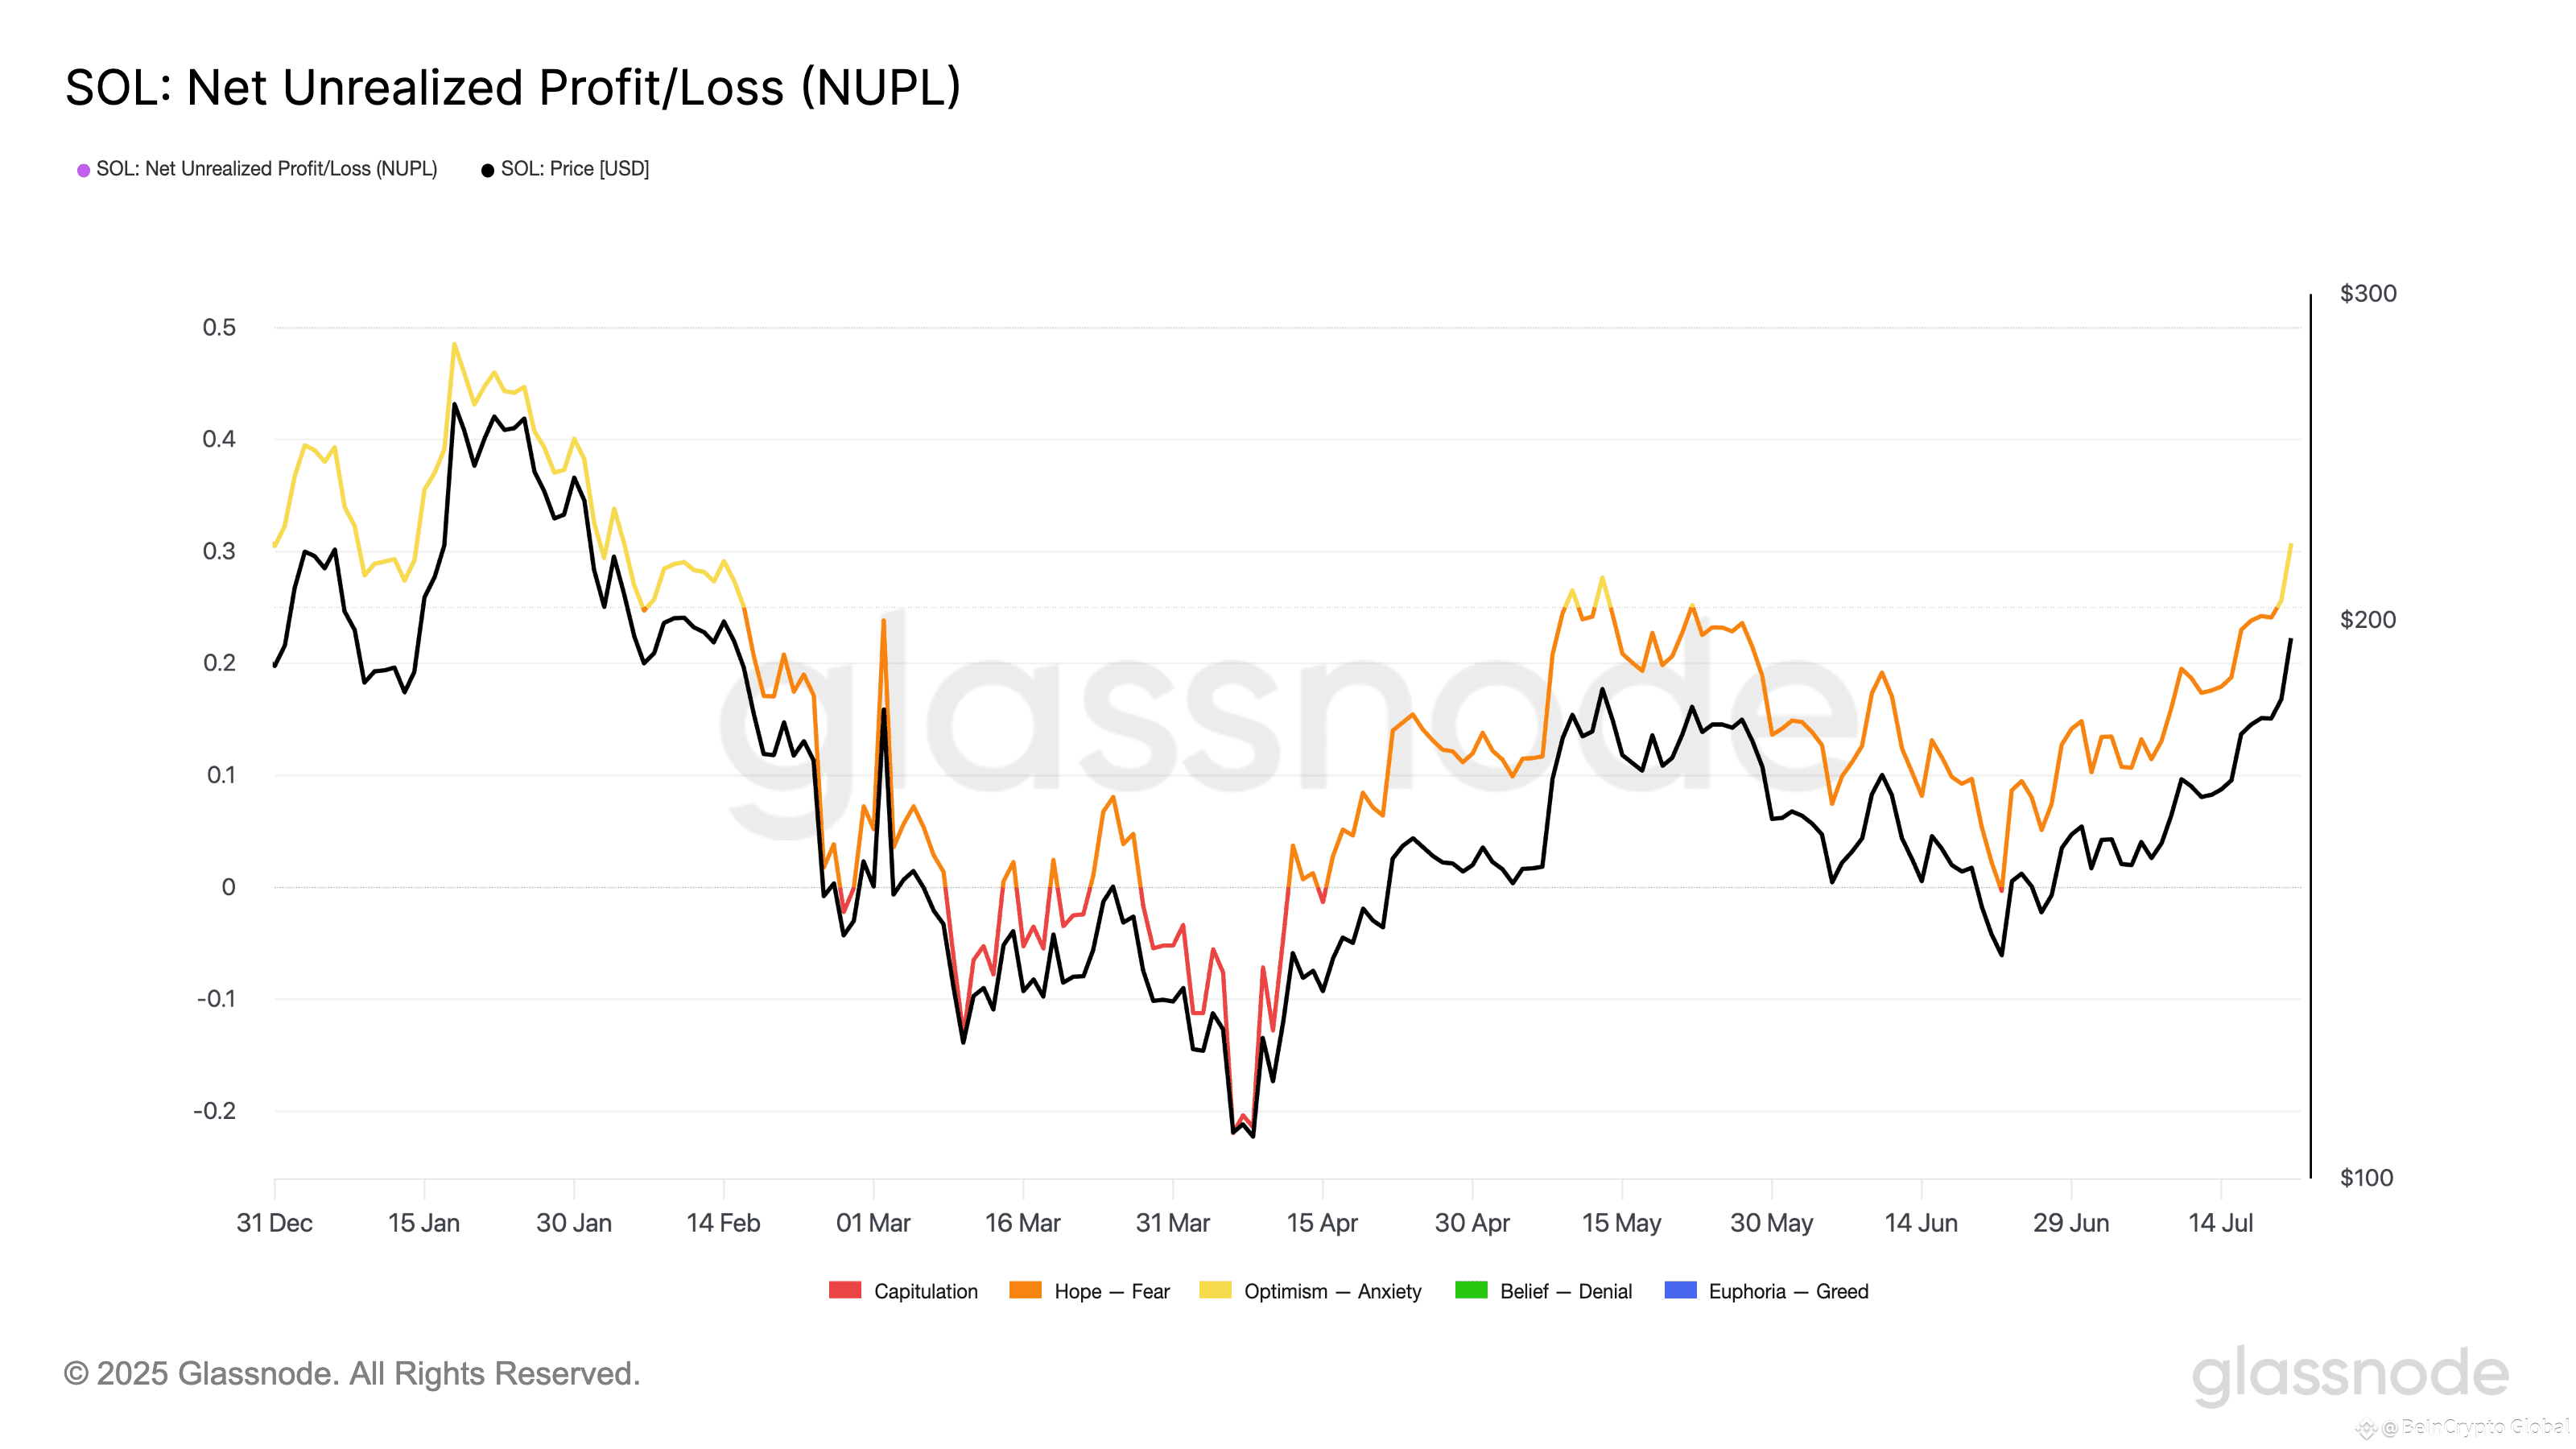 SOL Net Unrealized Profit/Loss. Source: Glassnode
The NUPL metric measures the difference between all holders’ total unrealized profits and unrealized losses relative to an asset’s market cap. It offers insight into whether the market, on average, is in a state of profit or loss.
The market is deemed to be in an optimism–anxiety phase when most investors are sitting on modest profits. They are hopeful but not fully convinced that a sustained rally is underway.
SOL has posted double-digit gains over the past week and now trades at $198.43, edging closer to the psychologically significant $206 level, a price it last held in February.
While some investors are holding firm in anticipation of a decisive breakout above $206, others remain skeptical that this key resistance will be breached. That tension is starting to show in market behavior as reflected by readings from the daily chart.
SOL Climbs Higher, But Traders Quietly Begin to Sell the Top
Despite the sharp price rally and increased on-chain activity, SOL’s BBTrend points to ongoing mild selling pressure. Over the past three days, the momentum indicator has posted red histogram bars whose sizes have gradually increased, reflecting the spike in selling pressure.
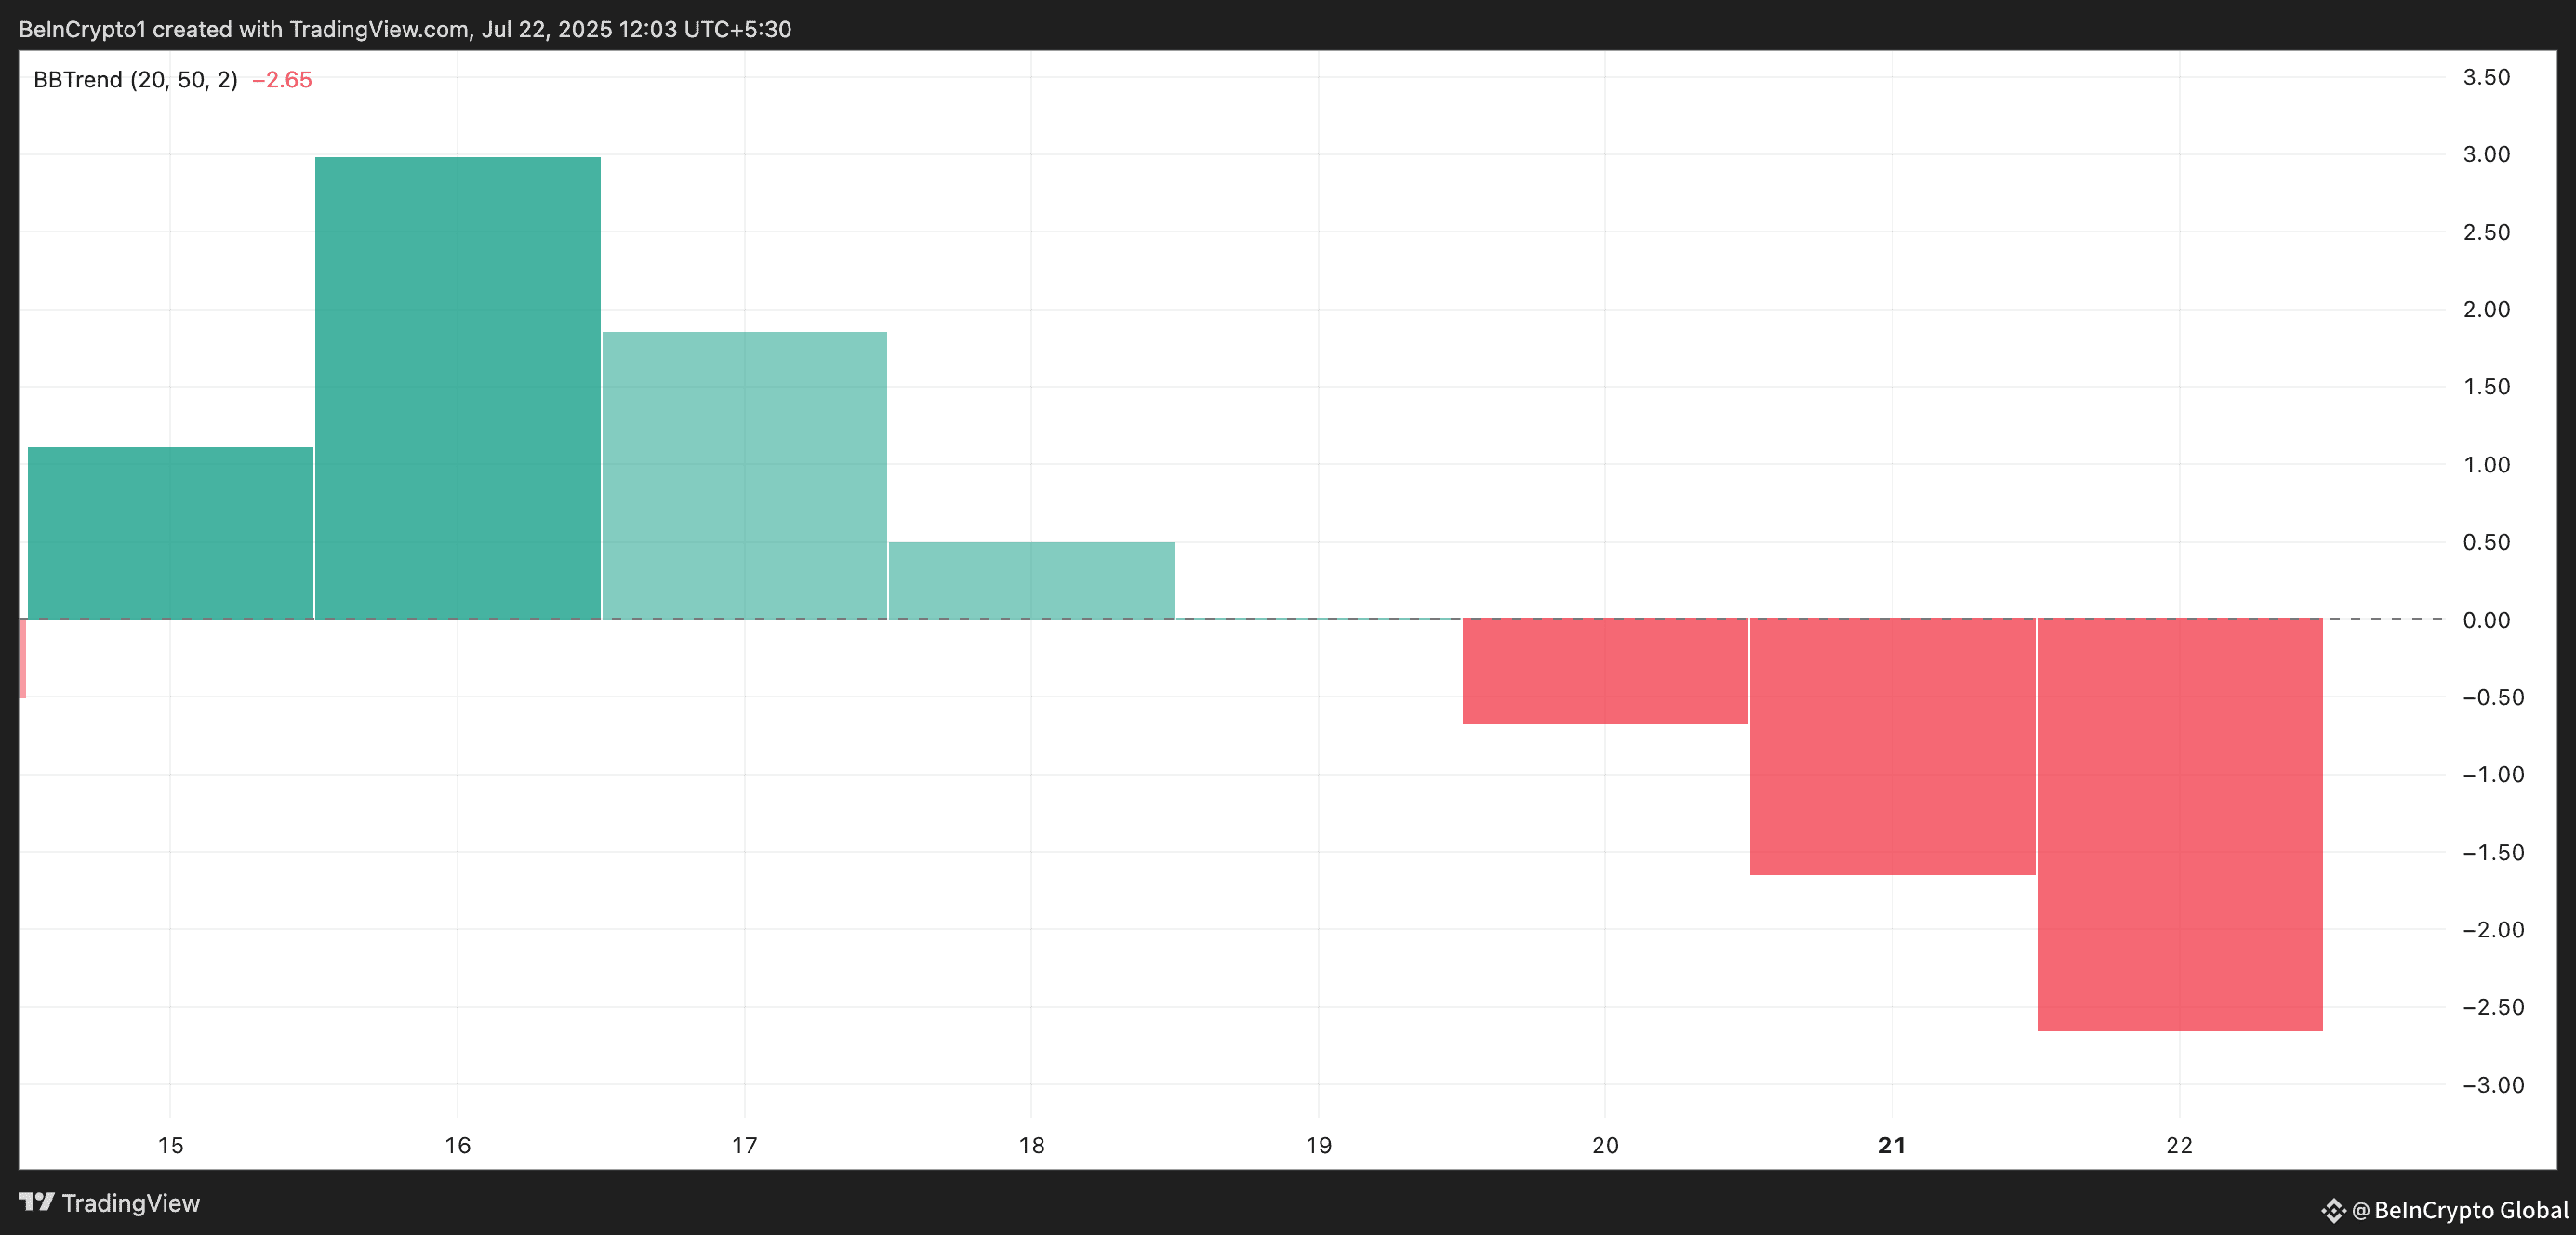 SOL BBTrend. Source: TradingView
The BBTrend measures the strength and direction of a trend based on the expansion and contraction of Bollinger Bands. When it returns red bars, the asset’s price consistently closes near the lower Bollinger Band, reflecting sustained selling pressure and hinting at the potential for further downside.
This suggests that, even as bullish sentiment grows, a segment of the SOL market is beginning to lock in profits, a potential early sign of wavering confidence.
Solana’s Fate Hangs Between $206 and $183
The $206 resistance level now stands as a crucial level for SOL. If buying pressure intensifies and SOL manages to break above this threshold, it could flip into a strong support zone, paving the way for a potential rally toward $219.97.
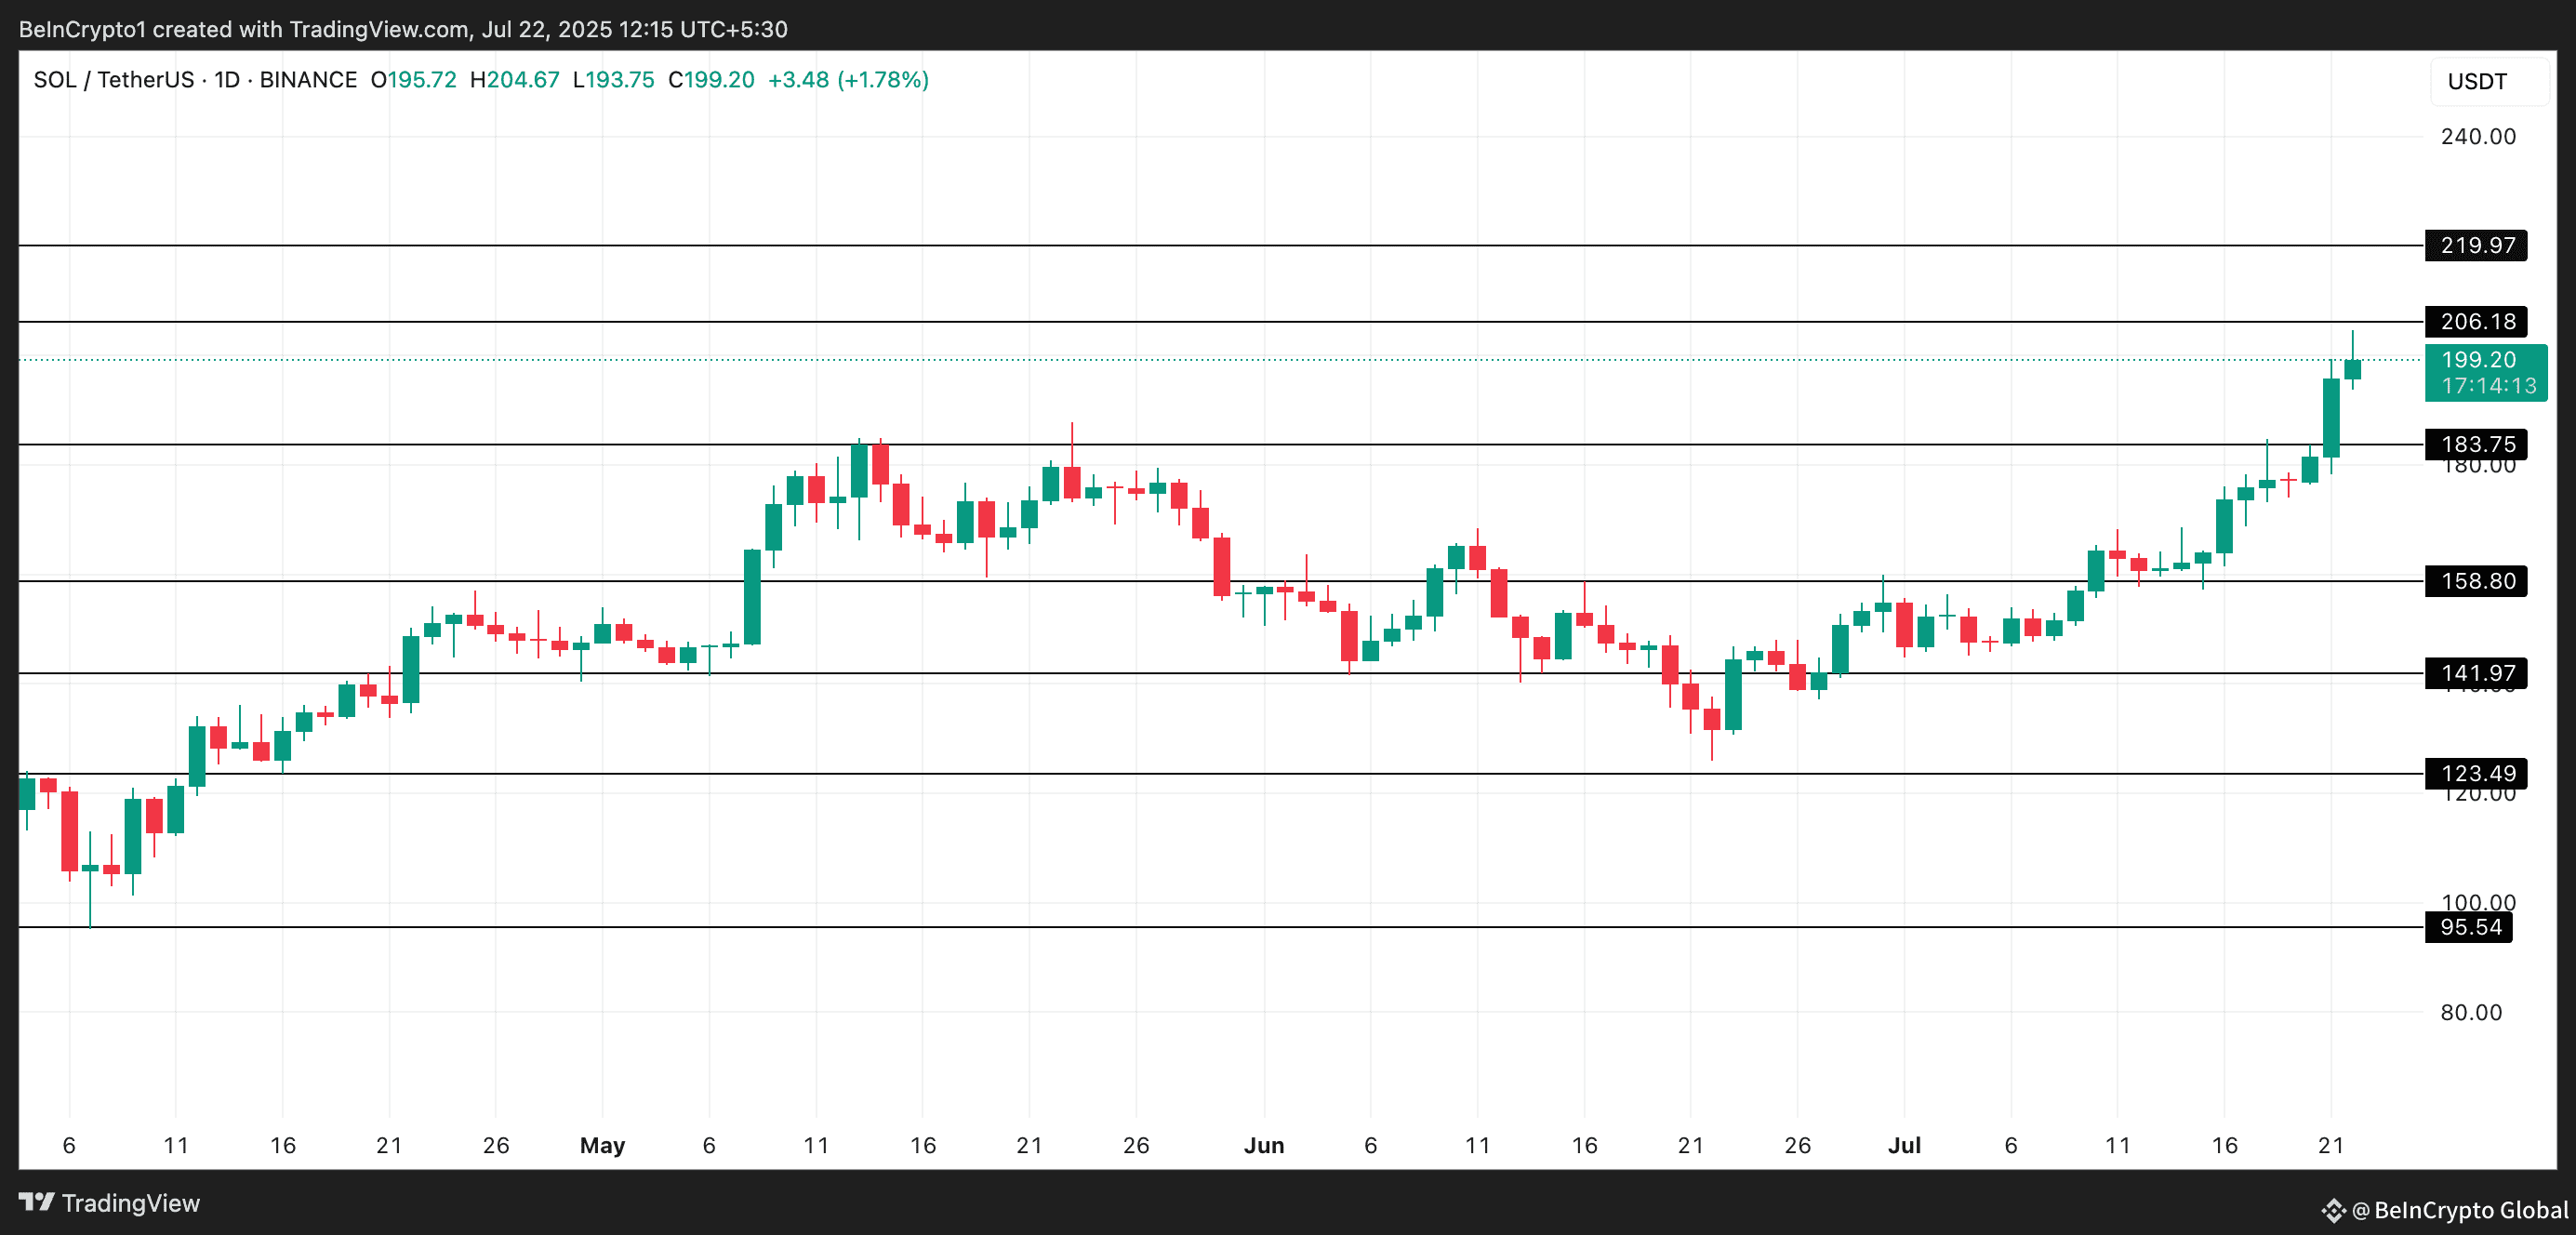 SOL Price Analysis. Source: TradingView
However, should selling activity escalate, SOL could shed some of its recent gains, pulling the price back down toward the $183.75 support area.
