

Ethereum trades at $3,703.90, marking a 4.1% rise in the past 24 hours.
Key resistance stands at $3,714.89, with strong support around $3,541.22.
The 0.886 Fibonacci level at $4,005 is the next critical barrier for upward movement.
Ethereum (ETH) is moving towards a major resistance area, driven by a steady upward momentum. ETH is changing hands at $3,703.90 at the time of the latest update, with a 4.1% increase in a day. The upward movement reflects resumed momentum after consolidating near recent support levels. The 0.886 Fibonacci retracement, which stands at around $4,005, is being watched by analysts as the next major resistance level.
The price action indicates that Ethereum is attempting to push to the top of the trading range. This corresponds to the general market order in which the price is currently rising above the price of $3,565, a main intraday line. Market participants await to see if ETH can maintain such bullish pressure without being rejected somewhere in the resistance area.
Market Metrics and Key Levels To Watch
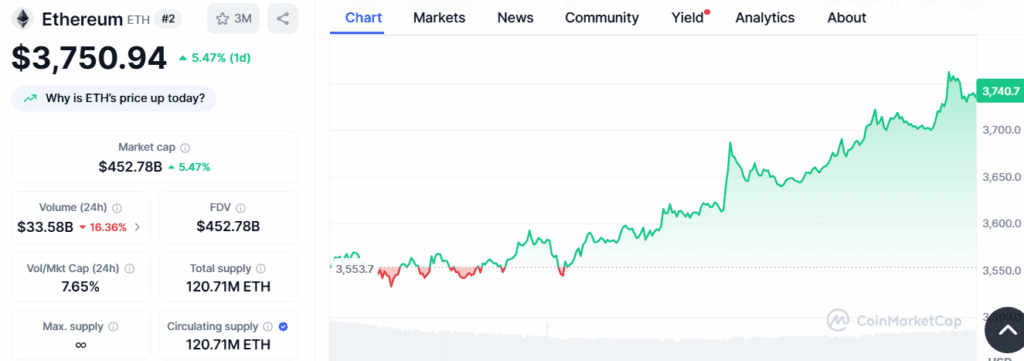 Source: CoinMarketCap
Support levels are closely tracked and the amount of $3,541.22 serves as the major support to price stability. On the upper side, a resistance point is marked at 3,714.89 which coincides with the price zone. Continued rallies that extend beyond this range might unlock the route to the $4,005 resistance point, which represents the 0.886 Fibonacci mark in the long-term screen.
Fibonacci Levels Indicating Future Price Zones
The Fibonacci retracement levels, particularly the 0.886 mark, are acting as significant technical indicators. The chart shows multiple levels beyond $4,000, including the $4,867.81 mark, which represents the previous peak. Additional higher targets are placed at $7,752.04 (1.272 extension) and $9,883.59 (1.414 extension), but these remain secondary as the $4,005 threshold dominates short-term focus.
https://twitter.com/cantonmeow/status/1946799550364033121
The continuation of the trading zone upwards will be determined by the reaction of ETH to the resistance line. Of interest, the 0.618 fibonacci retracement and 0.5 Fibonacci levels ($2,532.37 and $2,069.47 respectively) have been historical support during corrections in the past, thus providing context to the present uptrend momentum.
