

Bitcoin jumped from $90K to $118K and now shows a bull pennant near the 10-day moving average line.
The right shoulder formed at $102K and the breakout zone around $106K confirmed bullish trend momentum.
Traders now wait for a breakout above $124K as BTC holds steady just above the fair value gap area.
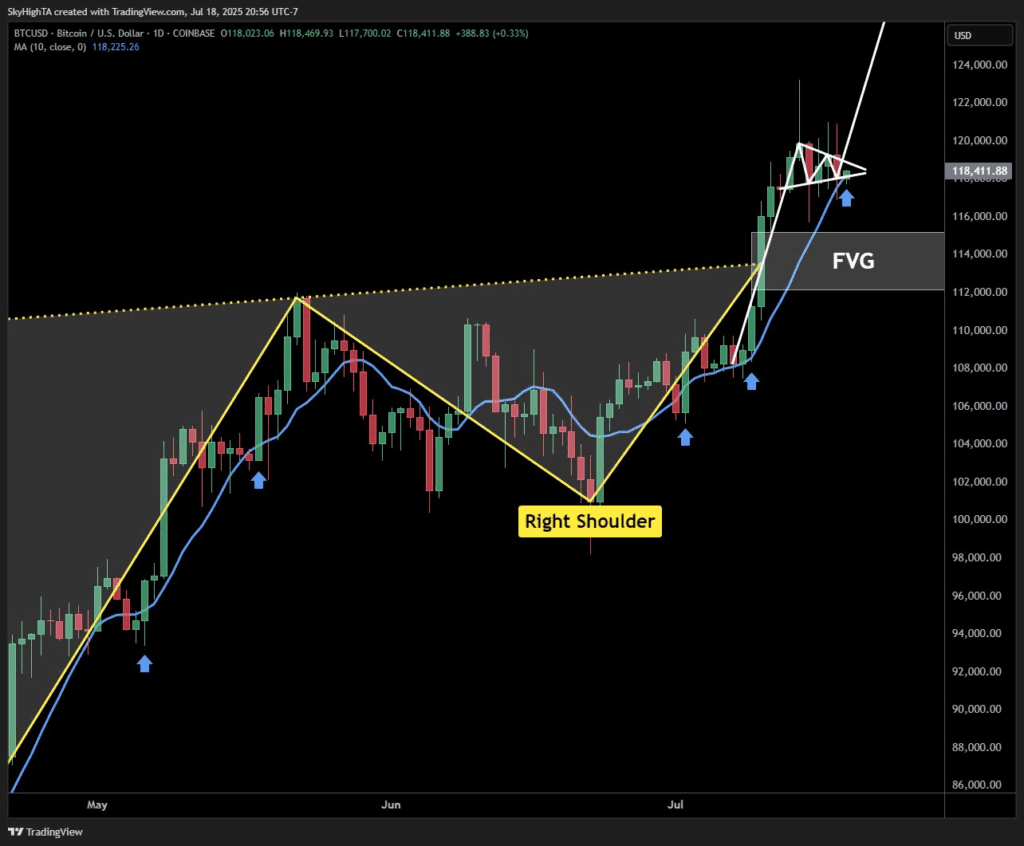
Bitcoin is trading at $118,411.88 after forming a bull pennant pattern near the 10-day moving average, according to recent technical analysis. The pattern follows a sharp breakout from a confirmed inverse head-and-shoulders formation with the right shoulder marked near $102,000. Analysts now await confirmation for the next upward move as BTC consolidates above $116,000 support.
 Source: X
The chart, shared by user @SuperBitcoinBro on July 19, 2025, gained over 16,000 views and features clear bullish momentum setup. BTC surged from under $100,000 to over $118,000 in less than one month. The current price action shows a pennant formation tightening around the $118,000 level with a projected continuation above $124,000.
A key level to watch is the 10-day moving average, marked at $118,225.26. This acts as short-term dynamic support and is the base of the pennant structure.
Inverse Head-and-Shoulders Breakout Unlocks Bullish Momentum
The chart reveals a large inverse head-and-shoulders setup, a traditional bullish reversal pattern. The neckline, drawn across the top of the formation, was broken earlier this month.
Bitcoin formed the left shoulder below $100,000, the head near $90,000, and the right shoulder close to $102,000. After reclaiming the neckline around $106,000, BTC rallied fast to the $118,000 range.
A fair value gap (FVG) zone is also visible between $114,000 and $116,000. This gap is defined as a wide-range candle body with no wick overlap, often left when price moves quickly. The chart’s author noted that unfilled FVGs frequently occur during rapid surges.
The price now trades just above this gap. If the pennant breaks upward, it may confirm the FVG acted as a successful launchpad.
10-Day Moving Average Supports Pennant Continuation
Technical traders are watching closely for confirmation from the current consolidation. The pennant has narrowed with clean trendlines, forming a triangle just above the 10-day moving average.
If BTC holds this level, the setup may suggest further upside. A breakout above the pennant’s upper trendline could propel price toward the $124,000 resistance zone. Historically, pennants follow high-volume price expansions, which Bitcoin displayed after reclaiming $106,000.
The setup implies the 10-day moving average at $118,225.26 is critical. Price has bounced from this level three times in recent sessions. Each bounce was marked with upward arrows on the chart, pointing to short-term buyer strength.
Community members responded with anticipation, with one user asking, “Will this breakout get us girlfriends?” The chart’s author replied, “Bigger levels to come,” suggesting higher targets ahead.
Will the Bull Pennant Launch Bitcoin Past $124,000?
The setup now leads to a pivotal question: Will this bull pennant breakout push Bitcoin into fresh highs above $124,000?
If the consolidation holds and the 10-day average provides support, technicals suggest more upside is possible. Analysts continue to monitor price action as Sunday’s candle approaches its close.
The current daily structure mirrors previous continuation setups seen during strong bullish phases. All eyes now rest on the breakout trigger above the pennant.
