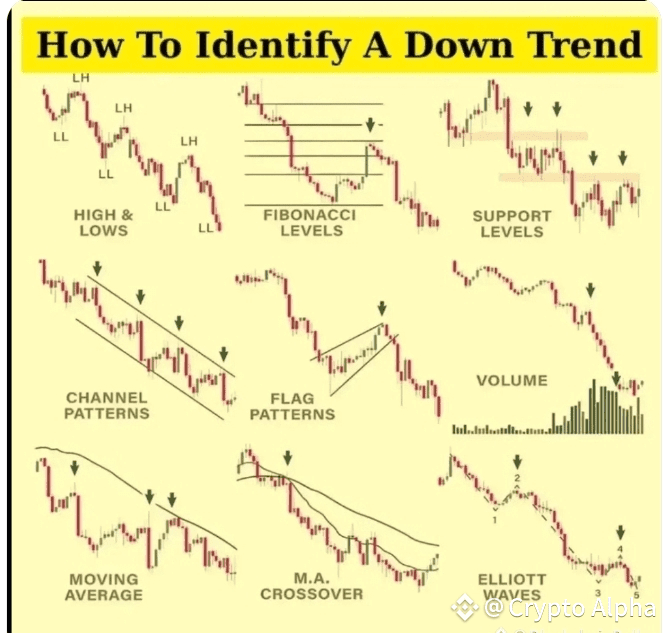
Understanding when a market is in a downtrend is crucial for every trader and investor. Recognizing the signs early can help you protect your capital, avoid unnecessary losses, and even find opportunities to profit by selling or shorting. Here is a simple yet complete guide on how to identify a downtrend effectively:
1. Lower Highs & Lower Lows
The most basic way to spot a downtrend is when the price keeps making lower highs and lower lows. This means that each time the price tries to rise, it doesn't reach the previous high, and each fall takes the price even lower. This sequence clearly signals that sellers are in control.
2. Fibonacci Retracement Levels
Traders often use Fibonacci levels to predict where price might reverse during a pullback. In a downtrend, after a small upward correction, the price often resumes its decline from a specific Fibonacci level like 38.2%, 50%, or 61.8%. If the price fails to cross these levels and drops again, it confirms the continuation of the downtrend.
3. Support Levels Breakdown
Support levels are areas where the price previously found buyers. But when the price breaks below a significant support level, it usually leads to further decline because buyers lose confidence and sellers gain strength. A breakdown of support is a classic sign of a continuing downtrend.
4. Descending Channel Patterns
Sometimes the price moves within a downward-sloping channel, bouncing between two parallel lines that are both moving lower. As long as the price stays within this channel, the market is considered to be in a downtrend.
5. Bearish Flag Patterns
After a sharp decline, the price may make a small upward move forming a flag shape. This is usually a temporary pause before the price resumes its fall. Spotting flag patterns can give early warnings of further declines.
6. Volume Increase on Declines
Volume plays a vital role in confirming trends. In a downtrend, if the price drops with rising volume, it indicates strong selling pressure. This validates the downward movement and signals that the decline is genuine, not just a random fluctuation.
7. Price Below Moving Averages
Moving averages like the 50-day or 200-day are often used to gauge the trend. If the price stays below these lines, the overall trend remains bearish. Moving averages act as dynamic resistance levels during a downtrend.
8. Moving Average Crossovers
Another powerful method is watching for moving average crossovers. When a short-term moving average (like the 20-day MA) crosses below a long-term moving average (like the 50-day MA), it signals a bearish crossover. This often indicates that the downtrend may continue.
9. Elliott Wave Theory
According to Elliott Wave Theory, market trends often unfold in wave patterns. In a downtrend, prices generally fall in a sequence of 5 waves. Recognizing these waves can help predict the continuation of a bearish move.
Conclusion
By understanding and observing these methods, you can easily identify when a market is in a downtrend. This knowledge not only helps you stay away from bad trades but also positions you to take advantage of bearish conditions through strategies like short selling.
Which of these techniques do you already use in your trading?