Kaspa price continues to trend upward after weeks of steady gains, but it’s now approaching a major decision point.
Buyers have kept momentum alive since late June, but the rally is starting to cool near a familiar resistance trendline.
The token is trading just below $0.092, with several bullish signals still flashing, though traders are eyeing the $0.096–$0.10 zone for signs of either breakout or rejection.
Let’s break down today’s setup for Kaspa.
What We Got Right Yesterday
In yesterday’s prediction, we noted the importance of the $0.096 level and how it could act as a major ceiling.
We also noted that a clean break above that range might open up a quick run toward $0.10 or even $0.11, while failure to break through could lead to consolidation back toward $0.088.
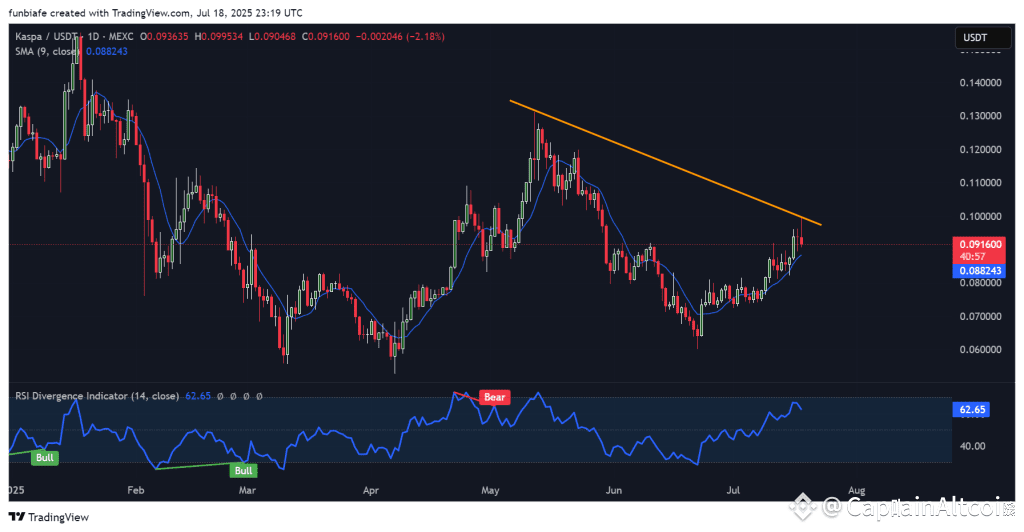
KAS price was pushed back from the descending trendline and is now hovering around $0.091, with bulls still holding the 9-day SMA as short-term support.
That resistance zone did, in fact, reject price during the last session. We also mentioned that price remained above all key short-term supports, which continues to be the case today.
Kaspa Daily Overview (July 19)
Current Price: $0.0916
24h Change: -2.18%
RSI (14): 62.66
SMA (9): $0.0882
Volume: Moderate
Kaspa price remains in a clear uptrend above the 9-SMA, with short-term structure intact. However, the price is testing a long-term descending resistance line that has rejected multiple rallies since May.
What the Kaspa Chart Is Telling Us
Kaspa chart structure shows a bullish short-term trend clashing with a bearish medium-term setup. Price has formed higher lows since June but remains within a broader descending channel.
 Source: TradingView.com
The orange trendline connecting lower highs is once again proving to be tough to break. A strong candle above $0.096 would flip that structure bullish, but so far the market has paused.
RSI at 62.66 is bullish, and all other momentum indicators are showing buy signals, MACD, CCI, and Stochastic included. ATR is also rising, and it signals volatility could increase in either direction.
Technical Indicators (Daily Timeframe)
Indicator Value Signal / Interpretation MACD (12,26) 0.003 Bullish crossover, building momentum CCI (14) 131.48 Strong bullish pressure, price above average RSI (14) 62.66 Bullish territory, not yet overbought Stochastic (9,6) 59.76 Trending up, more room to rise Ultimate Oscillator 52.51 Mild bullish bias ATR (14) 0.0059 High volatility, wider swings expected
Summary: All indicators favor the bulls, but breakout confirmation is still needed. Momentum is solid, yet price is hesitating just before resistance.
Kaspa Price Prediction Scenarios
Bullish Scenario:
A breakout above $0.096 with volume could trigger a rally toward $0.11. Indicators suggest this setup is building.
Read Also: Here’s Why Kaspa (KAS) Could Benefit Big From the CLARITY Act
Neutral Scenario:
Failure to break resistance may cause KAS price to move sideways between $0.088 and $0.096.
Bearish Scenario:
If price drops below $0.088 and the 9-SMA, the next support lies at $0.080. A close under that may revisit $0.075 or $0.066.
Wrapping Up
Kaspa price is in a bullish trend, with strong short-term energy driving further increases. Traders await, nevertheless, a confirmed breakout above the descending resistance.
The $0.096–$0.10 level is the battleground. Meanwhile, sideways motion or shallow dips remain possible.
Subscribe to our YouTube channel for daily crypto updates, market insights, and expert analysis.
The post Kaspa (KAS) Price Prediction For Today (July 19) appeared first on CaptainAltcoin.
