Here's an analysis of the provided BTC/USDT chart:
**Overall Trend:**
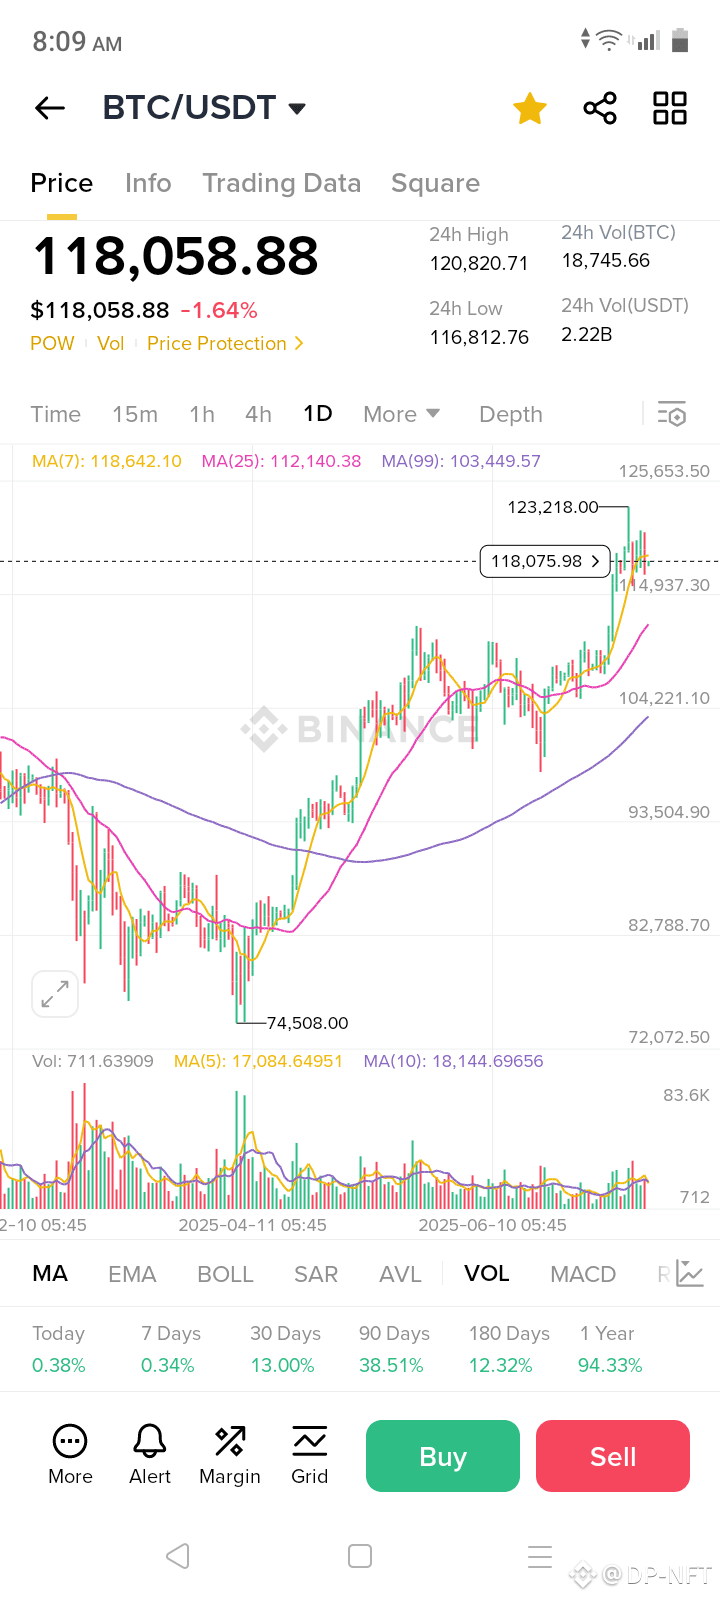
* The chart shows that BTC/USDT has been in a strong uptrend since around April 2025.
* There was a significant dip in April 2025, reaching approximately $74,508.00, but the price has since recovered robustly.
* The current price is $118,058.88, which is very close to its 24-hour high of $120,820.71, indicating strong recent upward momentum.
**Key Price Levels:**
* **Current Price:** $118,058.88
* **24h High:** $120,820.71
* **24h Low:** $116,812.76
* **Recent Support (from April dip):** Approximately $74,508.00
**Moving Averages (MAs) - Based on the visible indicators:**
* **MA(7):** $118,642.10. The current price is slightly below the 7-period MA, suggesting a very minor pullback or consolidation in the immediate short term.
* **MA(25):** $112,140.38. The current price is well above the 25-period MA, indicating a strong short-to-medium term bullish trend.
* **MA(99):** $103,449.57. The current price is significantly above the 99-period MA, reinforcing the long-term bullish trend.
* The fact that the shorter-term MAs (7 and 25) are above the longer-term MA (99) is a classic bullish signal (MA crossover).
**Volume:**
* The "Vol" (Volume) indicator at the bottom shows varying trading volumes.
* **MA(5):** 17,084.6951
* **MA(10):** 18,144.6956
* While there are spikes in volume, it's generally difficult to make definitive statements about volume trends without seeing more historical data or specific volume patterns related to price movements. However, healthy uptrends are often accompanied by increasing volume, or at least consistent volume.
**Percentage Change:**
* The price is down -1.64% currently, indicating a slight retracement from its intraday high, but still very high in the overall trend.
**Risk/Reward (POW - Price Protection):**
* The "POW | Price Protection" label suggests some form of risk management or insurance feature, but the details aren't visible. This is a platform-specific feature that might provide some downside protection.
**Overall Interpretation:**
The chart paints a largely bullish picture for BTC/USDT. The price has seen a significant recovery and is trading at high levels, well above its key moving averages. While there's a minor current pullback (-1.64%), the overall trend is strongly upward.
**Potential Considerations (not directly visible but important for a full analysis):**
* **Resistance Levels:** Where is the next potential resistance point above the current price? (e.g., previous all-time highs, psychological levels).
* **Support Levels:** What are the next immediate support levels if the current minor pullback continues? The MA(25) at $112,140.38 could act as support.
* **Market Sentiment:** What is the broader market sentiment for cryptocurrencies?
* **News/Events:** Are there any upcoming news or events that could impact Bitcoin's price?
* **Other Indicators:** The chart shows options for EMA, BOLL (Bollinger Bands), SAR, AVL, MACD, and RSI. Analyzing these would provide further insights into momentum, volatility, and overbought/oversold conditions.