
BTC/USD 1H Chart Analysis 🧠📈
Trend & Structure: Price is moving in a clear ascending channel, showing short-term bullish momentum.
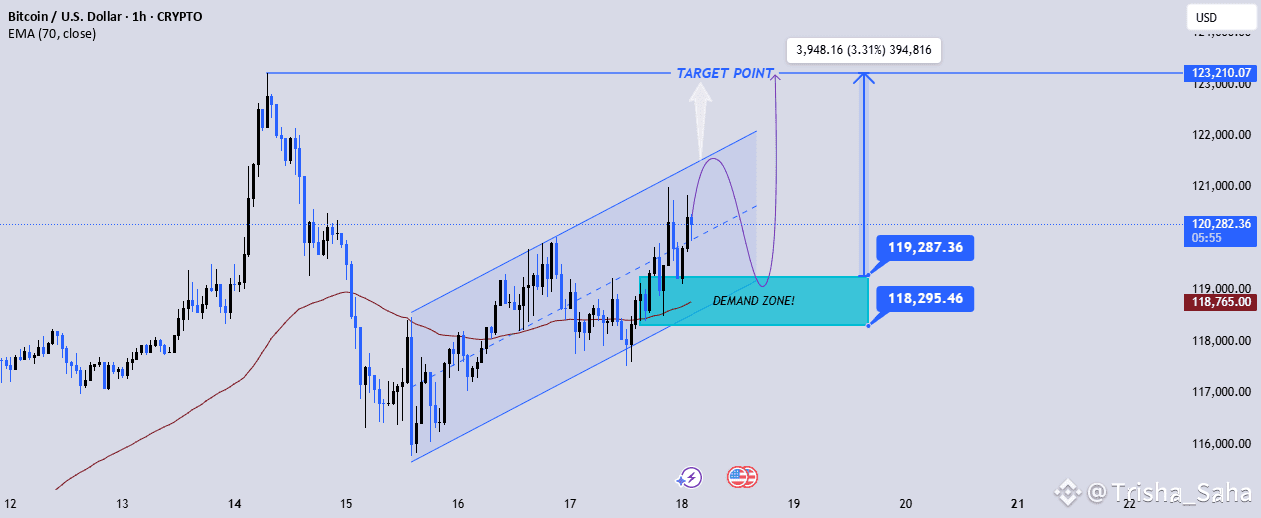
EMA Strategy: The 70 EMA is acting as dynamic support, reinforcing the bullish bias as price stays above it.
Demand Zone: Key support zone between 118,295 – 119,287 marked as a buy area. This zone aligns with previous price rejections and EMA confluence.
Price Projection: Expected drop into the demand zone followed by a strong bounce towards the target point at 123,210, offering a +3.31% potential move.
Candlestick Behavior: Bullish candles with strong wicks indicate buyers defending the lower boundary.
Volume & Confirmation: Await bullish engulfing or strong breakout candle from demand zone to confirm entry.
✅ Buy Setup: Enter on rejection from demand zone
🎯 Target: 123,210
🛑 Stop-Loss: Below 118,295 (structure break)
#ETHBreakout3.5k #BinanceHODLerERA #PowellVsTrump #AltcoinSeasonLoading #BTCWhaleTracker