
Here's an outlook based on the provided chart:
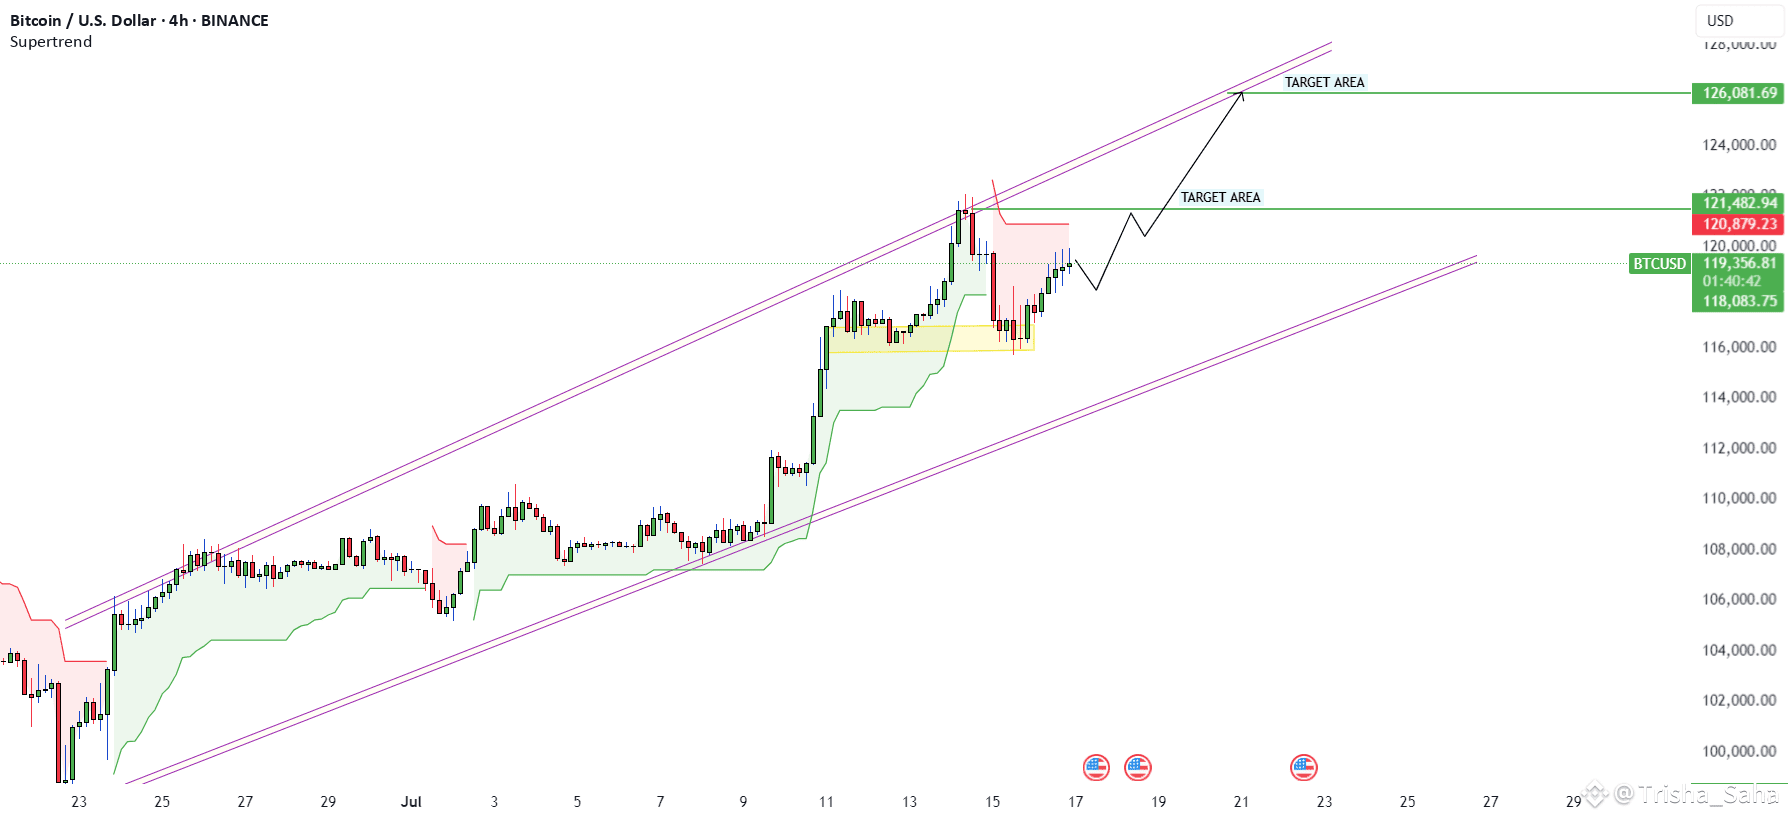
Overall Trend: The chart shows Bitcoin (BTC/USD) in a clear upward trend, moving within an ascending channel.
Current Price & Support/Resistance:
* The current price appears to be around $119.140.14
* There's a noticeable resistance level at approximately $121,492.94.
* A support level seems to be around $116,023.75.
Target Areas:
The chart indicates two "TARGET AREA" zones:
* Lower Target Area: Around $121,492.94.
* Upper Target Area: Around $126,981.49.
Recent Price Action:
* After reaching a peak (around $121,492.94), the price has recently seen a pullback or consolidation phase, characterized by some red candles.
* There's a short-term resistance line drawn indicating potential resistance around the recent highs.
* A small upward arrow pattern suggests a possible bounce or continuation of the uptrend from the current level.
Channel Analysis:
The price is well within the established ascending channel. As long as it remains within this channel, the bullish outlook is likely to persist. Breaking below the lower boundary of the channel would suggest a shift in the trend.
Outlook:
Based on the chart, the outlook for Bitcoin appears bullish. The price is consolidating within an uptrend channel, and there are clear target areas identified above the current price. A successful break above the immediate resistance around $121,492.94 could lead to a test of the higher target at $126,981.49. However, traders should watch for continued support within the channel and observe how the price interacts with the marked resistance levels.
#BinanceHODLerERA #AltcoinSeasonLoading #BTCWhaleTracker #BTC120kVs125kToday #USCryptoWeek