

1. Market Structure & BOS (Break of Structure):
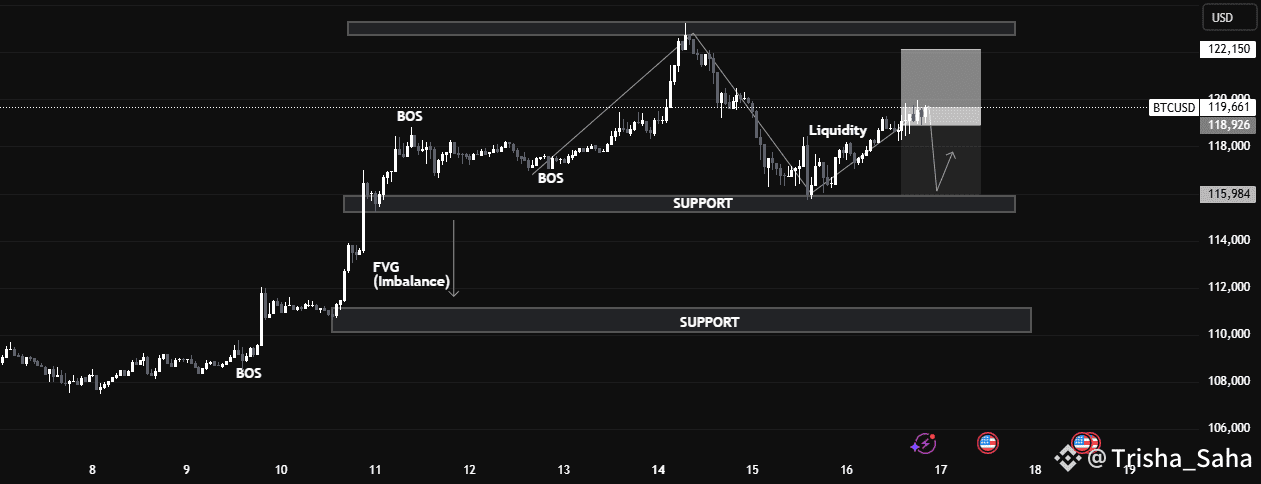
We can observe multiple BOS levels around July 10–12, signaling a strong bullish transition.
2. Break of Structure (BOS)
Definition: BOS occurs when price breaks above a previous swing high with conviction.
Application on Chart: The BOS on July 11 marked the continuation of bullish market structure.
This indicated strong buying pressure, often driven by institutional order flow.
📉 3. Fair Value Gap (FVG)
Definition: A Fair Value Gap is an inefficiency or imbalance in the market where price moves too quickly, skipping potential orders.
On Chart: The FVG is present between July 11–12.
Expectation: Price often returns to these zones to “rebalance” or mitigate orders before continuing the trend.
Educational Note: FVGs act as magnet zones and are often used to identify entry points or liquidity pools.
💧 4. Liquidity Sweep
Definition: A liquidity grab occurs when price spikes above a recent high or low to trigger stop-loss orders before reversing.
On Chart: Just above resistance, a liquidity grab took place.
Purpose: Institutions often sweep liquidity before large moves to fill larger orders.
🔹 Resistance & Supply Zone:
The resistance area between 122,150–123,500 has held firmly, causing a notable correction.
This region aligns with institutional order blocks, suggesting potential smart money selling.
🔹 Support & Demand Zone:
The nearest support zone lies at 115,984, marked by previous consolidation and BOS.
Price is likely to revisit this zone, acting as a retest for demand re-entry, providing a strong buy-side opportunity if confirmed.
🔹 Current Price Action:
BTC is consolidating around 119,253, with a possible liquidity sweep above short-term highs.
#BinanceHODLerERA #AltcoinSeasonLoading #BTCWhaleTracker #BTC120kVs125kToday #USCryptoWeek