
📊 Support and Resistance Levels:
🔼 Resistance:
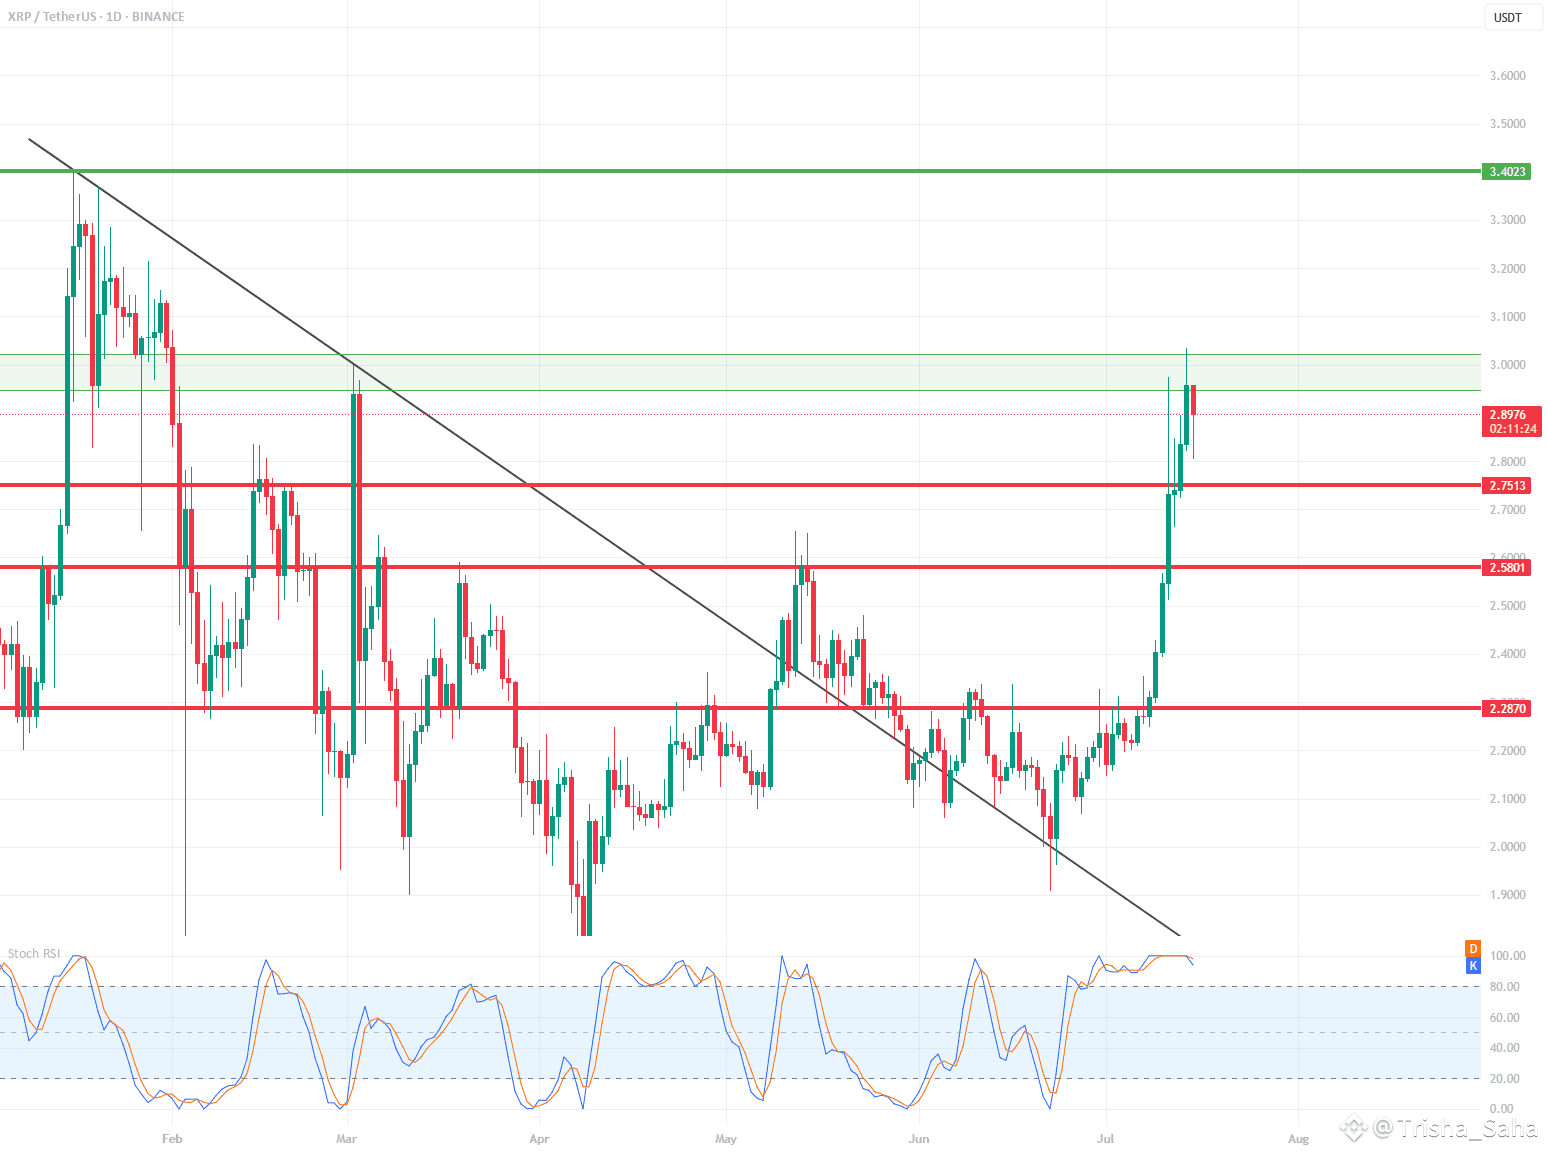
$2.95 - $3.02 – currently being tested, a local resistance zone. Price slightly rejected.
$3.40 – another strong resistance level from the previous high (visible on the left side of the chart).
🔽 Support:
$2.75 – the closest, recently broken support level.
$2.58 – another local support level.
$2.28–$2.30 – a very strong support zone that has been tested multiple times.
📈 Pattern and Momentum:
A breakout from a wedge-shaped downtrend with very high volume and long bullish candles indicates strong demand.
We are currently observing a correction/rejection at $3.02 – a possible short-term pullback.
🔄 Oscillator – Stochastic RSI:
The Stochastic RSI oscillator is in the overbought zone (near 100) – indicating possible consolidation or correction.
The curves are starting to curve downwards – a potential signal for a slight correction in the coming days.
🧠 Scenarios:
✅ Bullish (continued growth):
If the $2.95–$3.02 level is broken strongly and confirmed (e.g., by a daily candlestick closing above it), the target will be $3.40.
In this case, a quick rally to $3.40 is possible without major obstacles.
⚠️ Bearish (correction):
If the $3.02 zone holds as resistance, the price could retrace to $2.75 (the first local support).
If downward pressure persists, $2.58 could be tested.
📌 Summary:
XRP is in a strong uptrend after breaking out of long-term resistance.
In the short term, overbought prices on the Stoch RSI could trigger a correction to $2.75.
Key resistance: $3.02 – breaking it could signal further gains towards $3.40.
It's worth monitoring price reaction in this zone and candlestick confirmation.
#CPIWatch #AltcoinSeasonLoading #BTCWhaleTracker #BTC120kVs125kToday #USCryptoWeek