

1. Previous Price Action (Left Side)
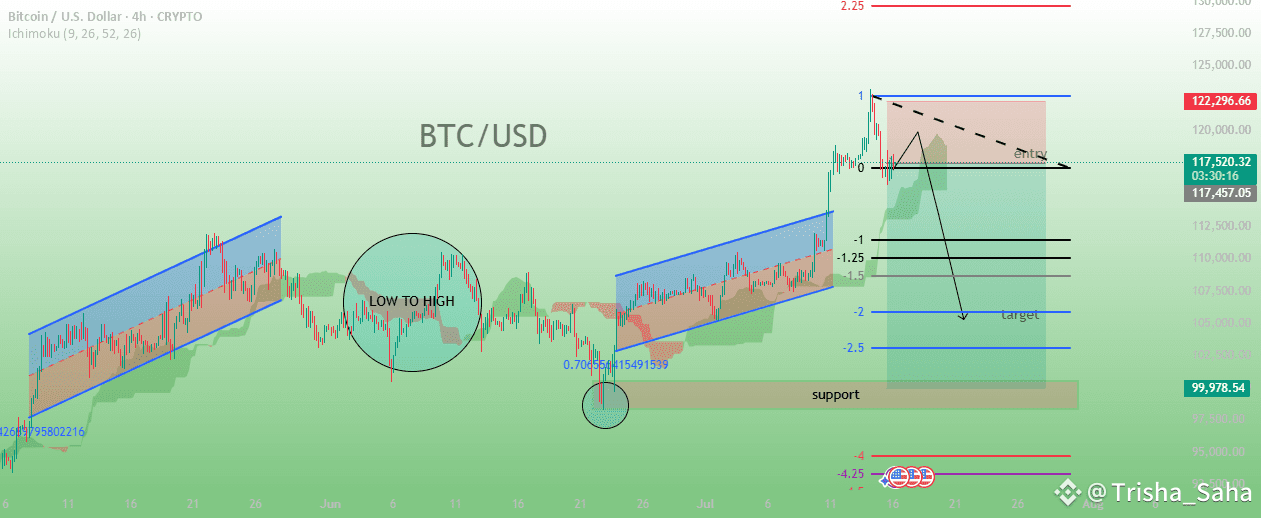
A significant accumulation phase is marked with a large green circle. This area likely represents a demand zone or a liquidity grab.
Following this phase, price rallies upward, entering a rising channel or parallel trend structure (highlighted in blue).
2. Channel Structure (Middle)
Price respects the channel and continues higher, making higher highs and higher lows.
Eventually, it breaks out strongly above the channel — a classic market expansion or premium pricing zone after accumulation and trend formation.
3. Premium Zone and Reversal Setup (Right Side)
At the top, a sell zone / imbalance area is highlighted in red/pink.
The market reaches an entry zone marked with a dashed line inside this premium area.
This is where a short position (sell) is anticipated.
4. Projected Price Path
A black arrow forecasts a move downward:
Entry → retrace downward
Targets labeled: -1.25, -1.5, -2.0, and so on (standard SMC/Fibonacci extensions)
Final target near 99,978.54, suggesting a bearish outlook.
5. Support Area
A green support zone is marked near the lower Fibonacci levels.
Suggests price might react here or reverse.
---
🔹 Technical Strategy Highlighted
Entry: After a premium zone grab / liquidity sweep.
Bias: Bearish after upward liquidity has been taken.
Tools Used:
Fibonacci levels
Channel analysis
Support zones
Market structure shifts
---
🔹 Conclusion
This is a classic SMC-style bearish setup:
Price grabs liquidity above highs (premium zone),
Enters sell zone,
Short trade anticipated targeting support/fib levels.
#CPIWatch #AltcoinSeasonLoading #BTCWhaleTracker #BTC120kVs125kToday #USCryptoWeek