
4-hour timeframe for Bitcoin (BTC/USD)), here’s the technical analysis and key downside target projections:
🔷 Key Observations:
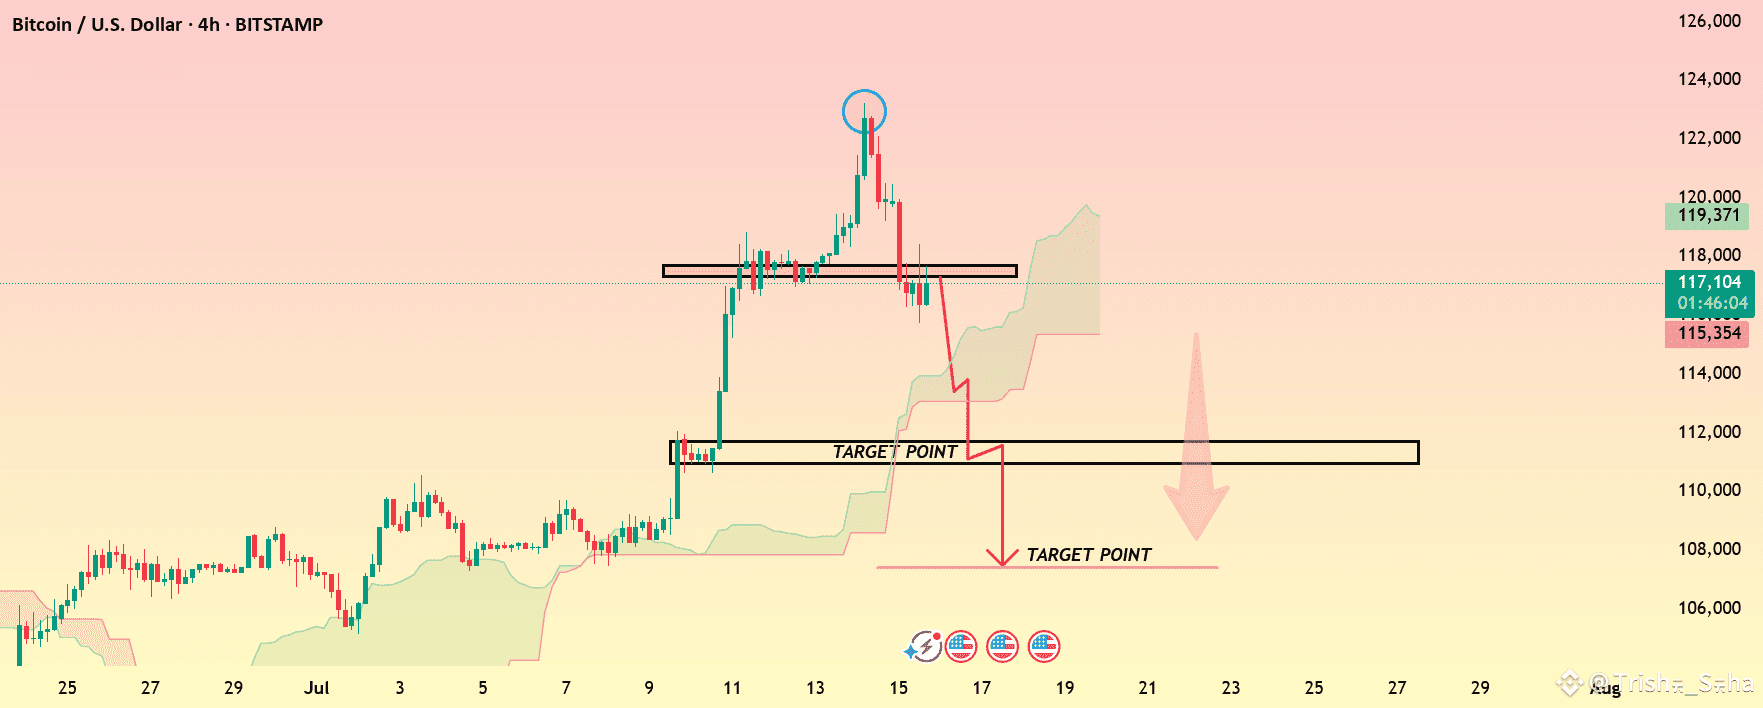
Price showed a parabolic bullish move, followed by a sharp rejection near the $120,000 level.
A double top pattern is visible, with the second peak failing to sustain above the resistance zone.
Price has now broken below the horizontal support zone, signaling bearish continuation.
The Ichimoku Cloud is also turning bearish, with price dropping below the cloud.
Two target points are clearly marked on the chart, suggesting possible bearish objectives.
🎯 Target Levels (as shown on chart):
1. Target Zone 1: Around $113,000
This is the first immediate support zone after the breakout.
Likely to act as the first bounce or consolidation area.
2. Target Zone 2: Around $108,000
A deeper support level where price may head if bearish momentum continues.
Aligns with previous consolidation structure.
📉 Conclusion:
After forming a double top and breaking below key support, BTC/USD appears to be in a short-term downtrend. If momentum persists, price may reach $113K and potentially $108K. The breakdown is confirmed by price action and Ichimoku analysis.
#CPIWatch #BTCWhaleTracker #BTC120kVs125kToday #USCryptoWeek #MemecoinSentiment