
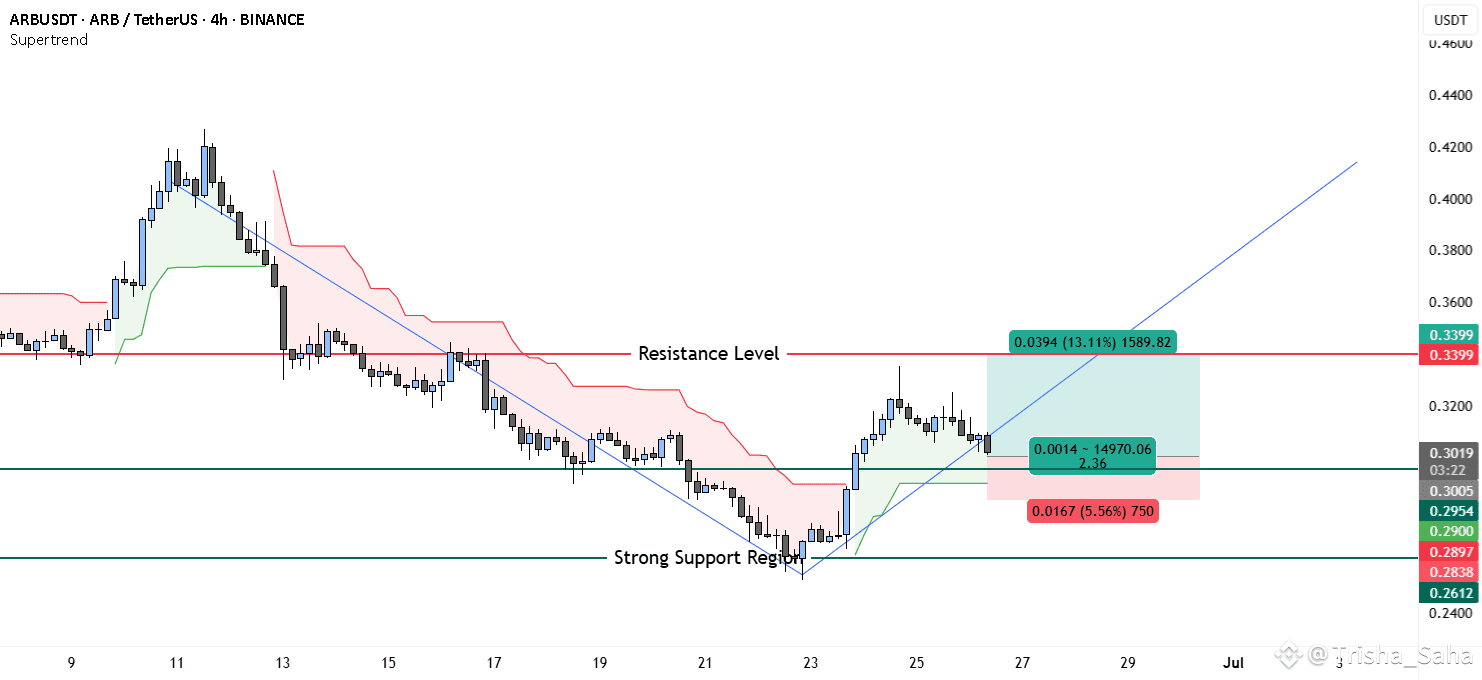
The price action of ARBUSDT has shown a significant reversal from a strong support region around 0.2612–0.2838 USDT, marked by bullish engulfing candles and a clear break above the descending trendline. This breakout is reinforced by the Supertrend indicator flipping green, signaling a potential shift in momentum toward the upside.
After bottoming out near 0.26, ARBUSDT has established a short-term higher low structure, and the current price action shows consolidation above the trendline, hinting at a possible continuation toward the next resistance.
A resistance level is marked at 0.3399, which coincides with previous supply and rejection zones. Volume and structure suggest buyers are regaining control, especially after holding support above 0.29 despite market-wide volatility.
📈 Trade Setup
• Entry Zone: 0.3000–0.3015
(Preferably on a bullish 4H candle close above 0.3000 for confirmation)
• Stop-Loss: 0.2838
(Just below the short-term demand zone and minor structure)
• Take-Profit: 0.3399
(Aligns with recent resistance and upper rejection zones)
• Risk–Reward Ratio: ~2.36
(Potential gain: ~13.11%, Potential loss: ~5.56%)
💬 Conclusion
ARBUSDT looks poised for a recovery after bottoming out near a strong multi-week support region. The break of the falling trendline and transition above the Supertrend resistance enhances the bullish outlook. A breakout above 0.3015 could lead to a push toward the 0.3399 resistance.
Note: If momentum builds above 0.3399, we may even see extension targets around 0.36–0.38 in the coming sessions. However, for now, staying disciplined within the trade plan ensures better risk control.