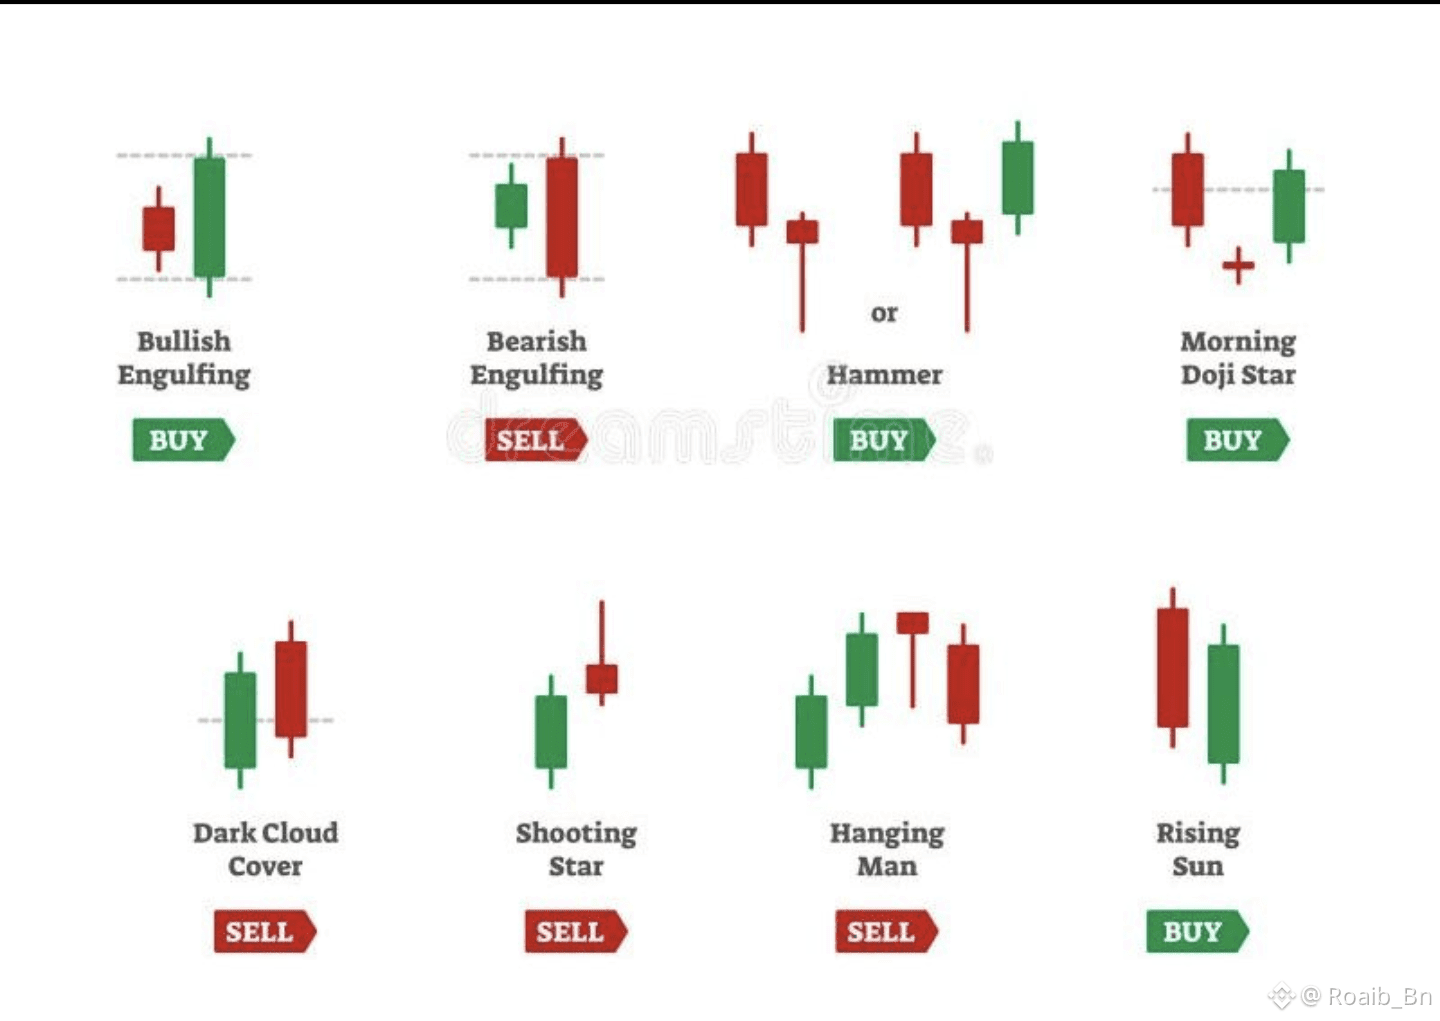
Bullish Engulfing👇
This pattern appears after a downtrend and signals a strong shift toward buyers. The green candle fully covers the previous red candle showing buyers have taken control and a potential upward move may begin.
Bearish Engulfing👇
This formation shows up after an uptrend and indicates selling pressure is increasing. The red candle engulfs the previous green candle suggesting buyers are losing strength and price may start falling.
Hammer👇
The hammer forms near market bottoms and shows rejection of lower prices. A long lower wick indicates sellers pushed price down but buyers stepped in strongly by the close.
Morning Doji Star👇
This is a three candle reversal pattern seen after a downtrend. It reflects market indecision followed by strong buying momentum which often leads to a trend reversal upward.
Dark Cloud Cover👇
This pattern appears near the top of an uptrend and signals weakness. Buyers fail to hold control as sellers push price deep into the previous candle showing a possible downside move.
Shooting Star👇
The shooting star forms after an uptrend and warns of a potential reversal. A long upper wick shows buyers tried to push higher but sellers quickly regained control.
Hanging Man👇
This candle appears at the top of an uptrend and suggests selling pressure is building. Despite closing near the top sellers showed strength during the session which can signal a coming decline.
Rising Sun👇
This pattern reflects strong bullish momentum after a decline. Buyers step in aggressively and push price higher indicating growing confidence and potential continuation upward.
HERE is the patterns image 👇
If you found this helpful then please follow like and comment on it thanks ❤️
#MarketRebound #BTC100kNext? #BinanceHODLerBREV #CPIWatch #USJobsData