The next Bitcoin block reward halving will occur around April 8, 2024. Historically, halvings have triggered three strikingly similar cycles. In this article, we will break down the past three Bitcoin cycles and predict the next one.
Topics we explore include:
What is the driving force behind Bitcoin cycles?
Operational and network KPIs for the first 3 cycles
Price trend over the previous 3 periods
Predict the next cycle
The driving force behind Bitcoin cycles
The Bitcoin block reward is halved every 210,000 blocks. In terms of time scale, the halving occurs approximately every 4 years. It marks a change in Bitcoin's monetary policy, reducing the block reward paid to miners (network inflation) by 50%.
In April next year, the Bitcoin block reward will drop from 6.25 BTC per block to 3.125 BTC.
Since new issuance is halved, it is reasonable to conclude that the reduction in new supply is the catalyst for each bull run.
The theory goes like this:
After the halving, miners sell less Bitcoin to the market. This consumes a large portion of the selling pressure. The price is at a boundary, and new buyers push the price higher. Then, the financial media starts talking about Bitcoin, people start Googling it, Bitcoin quickly becomes popular, new buyers enter the market, on-chain activity picks up, and venture capital firms put money into new businesses that support the ecosystem. So, more business = more marketing = more users, which in turn stimulates more buyers and more on-chain activity, as well as more media coverage.
Voila, a record high.
This is a great story, let's look at the data and see if it's true.

Net Position Change = The net change in Bitcoin held by wallet addresses that Glassnode has labeled as belonging to miners.
First halving: According to Bitcoin monetary policy, the annual new issuance is reduced by 1,314,000. But in the 12 months after the halving, the Bitcoin held by miners decreased by 4,458,603, which is more than twice the reduction in Bitcoin held by miners in the 12 months before the halving. In 2013, as the price of Bitcoin rose, miners sold a large number of Bitcoins. In the first halving cycle, a total of more than 8 million Bitcoins were lost from miners. As the price of Bitcoin was at a low level, buyers dominated the market.
Second Halving: 12 months after the halving, miners’ holdings of Bitcoin also dropped more than the 12 months before. Once again, price action was driven by buyers in the market. In total, more than 5.4 million Bitcoins were transferred from miners during the second cycle.
Third Halving: Miners sold more Bitcoin after the halving than in the previous 12 months. However, the third cycle was the first accumulation cycle for miners. We see a net position increase of 93k in the last 6 weeks (start of the fourth cycle).
A supply shock caused by reduced miner selling does not necessarily trigger a bull run. In fact, miners sell more Bitcoin in the 12 months after the halving than at any other time in the cycle.
That being said, the halving narrative may attract new buyers and the market can self-regulate. So even if the data contradicts the narrative, if people believe it is true, it probably is. Markets are reflexive like this, especially in crypto.
But there is more to this story…
Global liquidity
You’ll hear fewer and fewer quips about Bitcoin’s correlation to the global liquidity cycle, but this is where the data and price action actually line up.

Global liquidity appears to have bottomed out at the end of 22, which also marks the bottom for Bitcoin and the S&P 500. At the beginning of this year, we saw a slight rebound in global liquidity. Bitcoin rose 80%. The S&P 500 rose 15%.
In the US, inflation is over and the Fed has paused its rate hikes. Asset prices are up year to date and may continue to do so for a while.
But there are some dark clouds creeping in, and monetary policy could shift.
Specifically, $7 trillion in Treasury debt will mature next year. This debt needs to be refinanced/reissued to support fiscal spending. According to the Congressional Budget Office's May 2023 update, the U.S. deficit this year is expected to be $1.5 trillion.
Meanwhile, interest payments on the debt have now become the U.S. government’s second-largest expense, approaching $1 trillion a year.

In October, 43 million Americans will resume student loan payments at an average interest rate of $503 per month. According to the survey, 37% of borrowers said they need to cut back on other spending. 34% said they simply can’t afford the expense.
In addition, banks are still requesting to join the Fed's Term Funding Program for Banks:

Consumer credit card loans hit record high, exceeding $1 trillion:

Bank lending standards also suggest a recession is coming:

Finally, the commercial real estate industry has over $1.5 trillion in debt that will need to be refinanced in the coming years. This is because interest rates are at their highest levels since 2006. Of course, office space occupancy and valuations have declined due to remote work. To add insult to injury, a team of analysts at Citigroup found that over 70% of commercial real estate office loans are held by regional banks.
These factors should put further downward pressure on inflation.
Currently, CPI inflation swaps are pricing in 2% inflation as early as October this year. The Fed expects inflation to be 1.3% in a year.
Tying these together:
Bitcoin's market price lives and dies by liquidity. From a U.S. perspective, liquidity conditions appear to have bottomed out. We're hearing the same in China and Japan. Europe is in a similar situation. With inflation returning to 2%, the global economy should slow down.
At that time, the Federal Reserve will get the green light to change its monetary policy.
This will open the floodgates for another wall of quantitative easing. As for the timeline? We think it will happen in the next few years.
This shift in liquidity is consistent with the Bitcoin halving cycle and the narrative that comes with it.
Innovation Cycle: Operational and Network KPIs
Get it? Bitcoin cycles rely on liquidity. But liquidity is not everything.
If we are looking at factors like network growth, there may be gains.
Liquidity + growth in network fundamentals + the right narrative = new price discovery.
Reflexivity of new price discovery = new VC money. This leads to more construction, more users, and further price discovery.
It's the flywheel of speculation driving real capital formation and economic development. It's messy, but it's happening.
Bitcoin Network Basics

The Bitcoin network is strong on nearly every metric we track. We’ll list a few below:
Number of non-zero wallets: We have seen steady growth in non-zero wallets in each cycle to date. Our projections here are simply an extrapolation of last year’s growth (currently 47 million). Keep in mind that this number is not representative of all Bitcoin holders. Since the data is limited to on-chain wallets, it is not representative of tens of millions of exchange customers.
Developers: With the introduction of the Ordinals protocol, we have seen a recent increase in development activity.
Hash rate: An indicator of network security and miner sentiment. The hash rate has increased 3x over the past two years, which suggests that miners are bullish on Bitcoin.
Long-term holder behavior: One of the most important metrics we track. Long-term holders and the percentage of supply that has not moved in a year are currently at all-time highs. Through cycles, we observe that investors and users usually enter during bull runs. They then learn more about Bitcoin and tend to become long-term holders. We can observe this from the growth of wallets with more than 1 BTC, which recently exceeded 1 million. As long-term holders grow, it sets the stage for the next bull run, when buyers will finally take over the market.
Lightning Network: The Lightning Network is Bitcoin’s second-layer scaling solution. It enables payments at a much lower cost than transactions on the Bitcoin mainnet. While still in its infancy, we can see that the volume of transactions within the Lightning Network has grown significantly over the past few years.
Other catalysts
Coinbase sparked the 2013 bull run.
Ethereum provided fuel in 2017.
Microstrategy, Paul Todor Jones, Tesla, Block, Mass Mutual and others ignited the market in the last cycle.
What will happen in 2024/2025?
Approval of the BlackRock ETF would be a good start.
BlackRock has an impeccable reputation, with only one of its more than 500 ETF applications failing.
In some ways, the presence of the BlackRock name on the ETF makes more sense than the Bitcoin spot ETF itself.
The BlackRock name is important to RIAs, which is important to asset managers, which is important to nearly every investor on the planet.
In the past, investing in Bitcoin on behalf of clients could have exposed fund managers to career risks. The BlackRock ETF could turn that on its head.
Some food for thought: What happens if the bigger risk is not allocating 1% to Bitcoin through a trusted vehicle like the BlackRock spot ETF?
Price behavior in cycles and predicting the next cycle

5 key points:
Timing the Market: The best time to buy Bitcoin is when everyone thinks it’s dead. We have two chances in 2022. We reminded readers in December that Bitcoin was bottoming. Second, what is the second best time to buy Bitcoin? Historically, it occurs during any decline before the halving. Of course, timing the market is really hard. Dollar-cost averaging works well for an asset like Bitcoin that is in the early stages of global adoption. Even those who bought at the top of past cycles have done well over the long term. Bitcoin is currently down 55% from its all-time high, but its 10-year, 7-year, 5-year, and 3-year CAGRs are 84%, 73%, 36%, and 49%, respectively. The key is to have long-term conviction. Know exactly what you are buying and ignore the noise.
Prediction: Based on the previous 3 cycles, we predict that the rate of return will continue to decline. The target price of Bitcoin in this cycle is $158,000.
A higher level framework: We forecast a peak Bitcoin market cap of $3.15 trillion in the next cycle (up from $1.2 trillion in the previous cycle). This would put Bitcoin at 25% of the market cap of gold. Long-time readers know that we ultimately believe Bitcoin will reach and surpass the gold market (currently at $12.6 trillion).
Overall, we believe the total cryptocurrency market cap could surge to $8-10 trillion in the next cycle (from $3 trillion in the previous cycle). Interesting opportunities could arise in Ethereum, competing L1s, and critical infrastructure.
Post-Cycle Lows: We expect Bitcoin volatility to persist over the next few years. That being said, we expect volatility to subside over time. Growth in market size, more sophisticated investors entering the space, maturing market structure and products, new regulations, and less “Wild West” leverage will all contribute to this outcome. Note that Bitcoin acts like a commodity — the price far exceeds its production cost in bull markets, then falls to (and sometimes below) the production cost in bear markets.
A note on the last cycle: We believe that cycle did not play out to its potential due to the Chinese mining ban. If you remember, Bitcoin had just hit an all-time high, Tesla had just bought Bitcoin for its balance sheet, Michael Saylor had bought billions of dollars of Bitcoin through Microstrategy and the media tour. We believe that Bitcoin could have broken $100,000 without the Chinese mining ban. Since miners are concentrated in mainland China (cheap hydropower is abundant), the ban ultimately led to forced selling and capitulation events among miners.
Mid-cycle KPIs
Zoom out and see where we are today relative to past cycles.
Market Value / Realized Value:
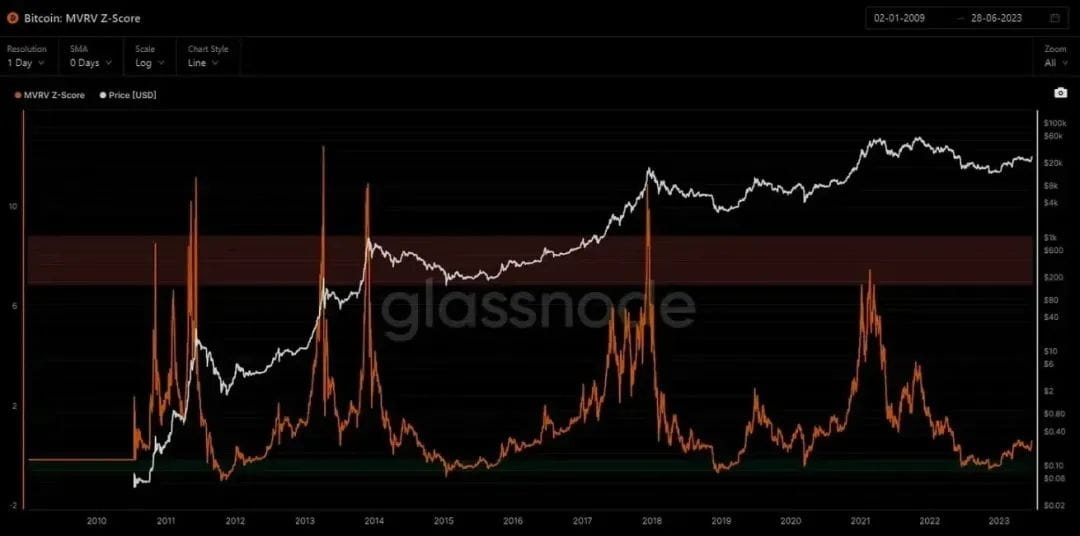
This metric measures the ratio of the market price to the average price per circulating Bitcoin. We moved out of the green zone in early 2023, which has historically been a good entry point. That said, we are still at relatively low levels.
Realized value:

Realized value is a proxy for the average price, or how much each bitcoin in circulation can be purchased for. Currently, that price is $20,323.34.
200-week moving average heat map:

In 2022, Bitcoin fell below its 200-week moving average for the first time in history and remained there for about nine months. Bitcoin has since recovered, with the 200 WMA currently sitting at $26,665.
in conclusion
Bitcoin’s adoption cycle is primarily driven by the “narrative” of global liquidity, network growth, and the halving supply shock. These three elements seem to fit together pretty well.
The most important one is a Bitcoin spot ETF with BlackRock’s name on it that could be approved in the coming months.
Original author: Michael Nadeau