Here are 6 practical methods that beginners can quickly master:
1. First, identify the trend: find the right general direction.
Uptrend: Consecutive positive candlesticks with closing prices rising one after another, indicating a bullish bias;
Downtrend: Consecutive negative candlesticks with closing prices decreasing one after another, indicating a bias towards short selling;
Trend reversal signals: Hammer candlesticks, inverted hammer candlesticks, etc., appear when the trend reverses and can be used as a reference for entry.
2. Closely monitor support and resistance levels: Find safe entry points.
Support level: The range where prices have repeatedly found support and rebounded. If a bullish candlestick (such as a small positive candlestick) appears when the price approaches the support level, it is a good time to go long.
Resistance level: The range where prices repeatedly stop rising and fall back. When a bearish candlestick (such as a small negative candlestick) appears near the resistance level, short selling is an option.
3. Observe the relationship between volume and price: to judge the stability of the market trend.
Price and volume correlation during an uptrend: Price increases accompanied by increased volume indicate strong buying pressure, making it a safer time to enter a long position.
Price and volume correlation during a downtrend: A price drop accompanied by increased volume indicates strong selling pressure, making short selling a more suitable entry point.
4. Recognize special candlestick patterns: Capture precise signals
Hammer candlestick pattern: At the bottom of a downtrend, the lower shadow is ≥ twice the length of the body, indicating a potential reversal to the upside, suggesting a long position.
Inverted hammer candlestick pattern: The upper shadow line indicates an upward reversal signal, suggesting a potential long position.
Three White Soldiers: Three consecutive positive candlesticks, with the closing price exceeding the highest price of the previous candlestick, indicating a strong upward trend, suggesting a potential long position.
Bullish Harami Pattern: A long bearish candlestick is followed by a short bullish candlestick (the bullish candlestick is inside the body of the bearish candlestick), indicating that the downtrend has ended and a long position can be taken.
5. Combining technical specifications: Adding double insurance
Moving average crossover: When a short-term moving average crosses above a long-term moving average (e.g., the 5-day moving average crosses above the 10-day moving average), forming a golden cross, it indicates a potential long position.
MACD indicator: The short-term moving average crosses above the long-term moving average to form a golden cross, indicating increased bullish momentum and a buy signal.
6. Implement effective risk management: ensure principal protection.
Set stop-loss orders before entering a trade: for long positions, set the stop-loss below the support level; for short positions, set the stop-loss above the resistance level to control losses.
II. Guide to Avoiding Liquidation with a Principal of 1000 USDT: To Succeed in the Crypto World, First, Do These 4 Steps Right
Recently, many fans have asked, "Why don't I get liquidated with 1000U?" and "Does low leverage mean slower profits?" The answer is: If you want to turn your fortunes around, don't be greedy. First, learn this "survival + steady profit" strategy.
Step 1: Split the position – Reserve a “second chance”, split 1000U into 10 parts.
The 1000U is split into 10 parts, with only 100U used for each transaction, and the remaining 900U is deposited into an investment account. This step determines whether you will "lose everything at once." If you do lose, you still have 9 parts of principal to start over, avoiding going all in and losing everything.
Step Two: Leverage – 20x or less is enough; don't gamble.
Keeping leverage below 20x allows you to profit from market fluctuations without the emotional turmoil caused by small swings. 100x leverage can generate quick profits, but a single adverse move could wipe out your entire account, leaving you with no chance of recovery from your initial 1000 USDT.
Step 3: Stop Loss – If you lose 100 USDT, accept it; don't hold onto the position or add to your position.
If you lose 100U, cut your losses immediately, review the trades (market judgment/entry timing), and take a 1-2 day break to adjust. Avoid averaging down, adding to your position, or stubbornly holding on, to prevent losing another 900U.
Step 4: Control the pace – Once you've made a profit, transfer it out first, leaving only 100U for rolling over the position.
If you earn 300U from 100U, transfer 200U back to your investment account, leaving only 100U for the next round. Each transaction always starts with 100U, profits are accumulated, and subsequent losses only affect the profits, ensuring the safety of your principal.
Finally: The truth behind beginners' account blowouts – it's not the market's volatility, it's their impatience.
Most people lose everything because they're desperate for quick riches: going all-in, using high leverage, and stubbornly holding on. Remember: even with a 90% win rate, one mistake with a fully leveraged account can lead to utter ruin.
The cryptocurrency market is highly volatile; without position management and emotional control, you won't go far. Futures trading tests your character; it's not about making slow profits, but about losing quickly. Stay calm and take it slow; "survival" is the most valuable asset. Your initial 1000 USDT will eventually grow into much more.
Cryptocurrency Trend Catcher: The Most Accurate Technical Indicator for Identifying Trends: A Comprehensive Analysis of the Wes Wave Trading Strategy
"A wave of buyers is followed by a wave of sellers, alternating like a seesaw until one side gains the upper hand." — David H. Weis
In technical analysis, traders and analysts are always looking for adaptable ways to interpret market trends and make informed decisions. Weis Wave is one such method that has gained increasing attention. Originating from the principles of Richard D. Wyckoff and refined by Wall Street financial magnate and renowned trader David Weis, it offers a flexible approach to understanding price movements and volume trends in financial markets.
The history of the Weiss Wave indicator
The Wyckoff method, developed by Richard D. Wyckoff in the early 20th century, primarily focuses on analyzing price action and volume to identify the driving forces behind supply and demand. David Weiss expanded upon this by introducing the concept of "waves," allowing for a more detailed observation of the relationship between price and volume. David Weiss was a follower of the Wyckoff price action analysis method, studying it for over 50 years.
The image below is from Richard D. Wyckoff's investment and trading course:
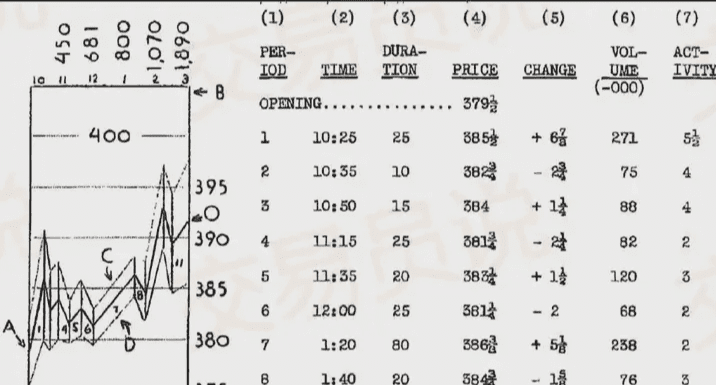
Wyckoff manually drew charts, breaking down market movements into a series of upward and downward waves, and then wrote down the characteristics of each wave on the right side of the chart. By comparing these waves, he drew important conclusions about the true strength of the market. His method taught how to use this analytical step.
You should think of the market like waves. — Richard D. Wyckoff
David Weiss further developed Richard Wyckoff's concept. With the advancement of software, constructing charts and analyzing the alternating fluctuations of price and volume across different markets and timeframes became much easier. In his book, *Trades About to Happen: A Modern Adaptation of the Wyckoff Method*, Weiss wrote:
"Price movements unfold in waves, rather than changes over equal time periods; wave-like volume reveals more market information than hourly or daily charts."
The core of the "Wes Wave" method lies in its provision of a clear and comprehensive observation of the cumulative price and volume over a series of price fluctuations (called waves). Unlike traditional volume analysis, which typically only examines the volume bars corresponding to a single price bar, Weis Wave accumulates volume over a longer price trend. This method effectively filters out market noise, allowing traders to observe the dominant market forces more clearly and reliably.
Components of Weiss wave analysis
Price Waves: Price waves represent the directional movement of prices over a specific period of time. A wave is defined by the start and end points of the price movement. For example, an upward price wave begins at a low point and continues until the price reaches a new high point. Conversely, a downward price wave begins at a high point and moves to a new low point.
Volume Waves: Volume waves are the cumulative trading volume of each price wave. By summing the trading volume during price waves, traders can gain insight into the strength and confidence behind price movements. For example, if there is a significant increase in trading volume during an upward price wave, it indicates strong buying power, and the trend may continue.
Wave Charts: Weiss Wave analysis typically uses wave charts for visualization. These charts plot the cumulative volume of each price wave, creating a graphical representation of market dynamics. Wave charts help traders identify trends, reversals, and potential support and resistance zones.
Weiss Wave analysis is applicable to different timeframes and asset classes, making it a versatile trading tool. Key applications include:
Trend identification: By analyzing the cumulative trading volume during price waves, traders can determine the strength of the current trend. Strong volume waves along the trend direction indicate high market participation, and the trend may continue.
Reversal signals: Divergence between price waves and volume waves may indicate a trend reversal, such as an upward surge. For example, if the price makes a new high, but the corresponding volume wave declines, it may indicate weakening buying interest and a potential trend reversal.
Support and Resistance Levels: Weis Wave analysis helps identify important support and resistance levels. High-volume waves at certain price levels indicate concentrated buying and selling interest, providing traders with potential entry or exit points.
Market structure analysis: By studying the sequence and magnitude of price and volume waves, traders can gain insights into market structure and the behavior of different participants. This understanding helps optimize decision-making and risk management strategies.
How the Wes Wave Indicator Works
"Changes in trading volume tell us about supply and demand; price merely represents the value of that volume." — Humphry B. Neill
The Wes Elliott Wave indicator accumulates the trading volume in each wave, thus providing us with a cumulative trading volume histogram of alternating waves.
In other words, it is the cumulative trading volume that makes the Weiss wave chart unique. It can be used to compare the relationships between wave sequence characteristics, such as the correspondence between the applied force (represented by trading volume) and the obtained result (price change).
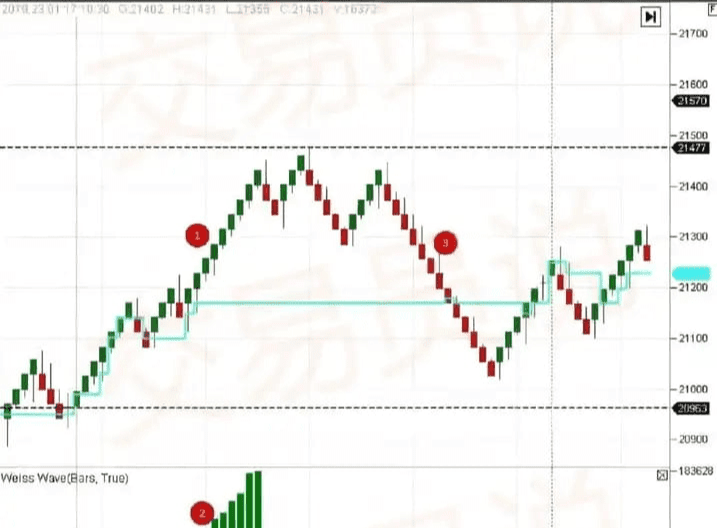
Points 1 and 2 mark an upward wave, with both price and volume increasing in tandem. Points 3 and 4 mark a downward wave, with prices falling while volume increases. The downward wave washes away all buying efforts, indicating the market's reluctance to break through the 21300-21400 area.
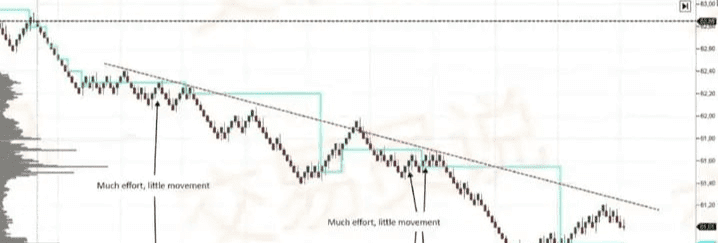
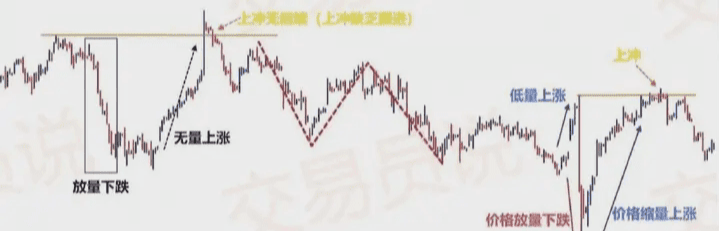
The arrows mark the buyers' attempts to resist the downward trend. Each trading volume was significantly higher than previous waves, but the price increase was slow.
Wave charts can clearly show trend reversals.
Measurement criteria for a single wave
Length: a temporal characteristic;
Volume: The total number of contracts traded in one direction;
Height: The price progress achieved.
By comparing the characteristics of each wave with the previous or next wave, analysts can obtain information about the overall state of the market.
You can also find divergences in wave charts, which are similar to the divergences in MACD, Stochastic, and RSI indicators at important price levels.
In which charts does the Wes Wave perform better?
David Weis conducted extensive experiments with Wyckoff dot-number graphs. He focused on two parameters:
How to choose the reversal amplitude;
How to identify the accumulation line—the price equilibrium area, which may become the starting point of a concentrated movement.
David Weiss believes that Renko charts and Tick charts are best suited for wave analysis. He writes that Renko charts are closest to the original Wyckoff order book reading charts because they are not time-dependent. "...Renko charts bring peace of mind and reduce the number of decisions." Below, we will compare the performance of the adjusted Weiss Wave Indicator on different chart types.
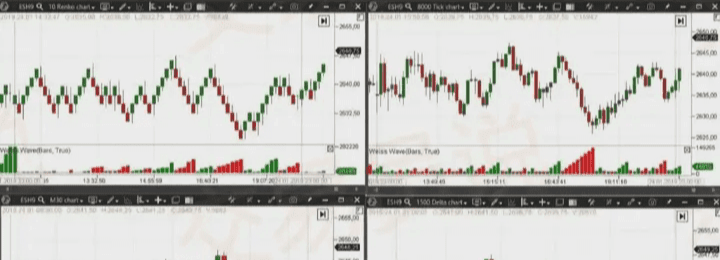
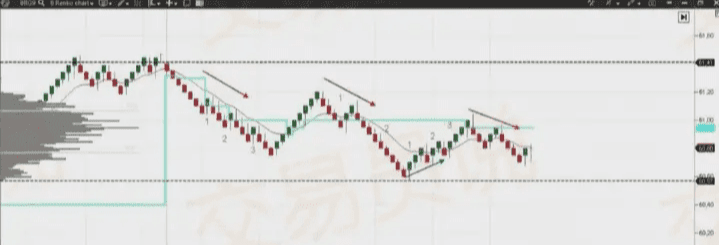
The performance of the Wes Wave indicator across different chart types:
1. Top left: Renko chart with a period of 10, the waves are clearly visible and can be measured by height and length;
2. Bottom left: 30-minute candlestick chart. Some waves are clearly visible, but there are periods when the wave bars are chaotic, making it difficult to understand the actual market situation.
3. Top right: Tick chart with a cycle of 8000, the waves are almost as clear as those in the Renko chart;
4. Bottom right: Delta chart with a period of 1500. This chart also shows the wave sequence, but it is not as clear as the Renko and Tick charts.
When Weiss developed the Weiss Wave indicator, Delta and Cluster charts didn't exist yet, but he probably would have loved using them. You can try using these charts for analysis now.
How to use the Wesley wave indicator to analyze the market
When using the Wes Elliott Wave indicator, the following intraday scenarios typically occur:
Shorten the pace of progress
consolidation
Spring and upward stroke
A comparison of effort and reward
Mobility
Wave reduction
Deviation
The following will elaborate on each point.
1. Shortened the pace of implementation
Wave contraction and narrowing price changes indicate that the current trend is weakening.
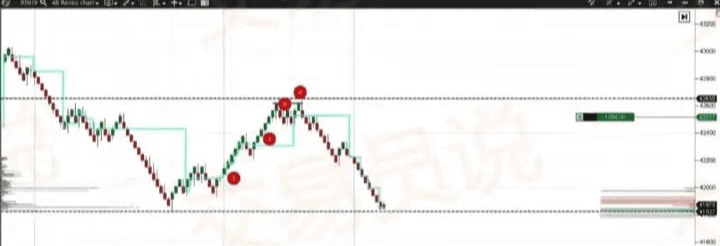
In addition to the Wesley Wave indicator, the chart also displays a dynamic level indicator to show the movement of the day's maximum volume level. The day's high and low are represented by dashed lines. Two top patterns appear on the chart, and at the maximum volume level, the upward momentum shortens, presenting a trading opportunity.
Note: In the first two waves, price and volume increased in tandem. However, the high of the third wave was lower than the previous high, and the fourth wave formed a double top. A divergence appeared in the wave chart (indicated by the red arrow). At this point, the volume of a new round of selling from the double top immediately exceeded the volume of the previous round of buying (indicated by the black line). On that day, Rosneft's stock price continued to fall against the backdrop of the Venezuelan political events. But you don't need to understand complex geopolitics; you can make money in this trading environment simply by understanding chart signals.
2. Consolidation
Gentle waves represent market compression or consolidation. Typically, after consolidation, prices will continue moving in the original trend direction. However, if a large volume pattern with higher lows appears at the end of a downtrend, or a large volume pattern with lower highs appears at the end of an uptrend, it may indicate a trend reversal.
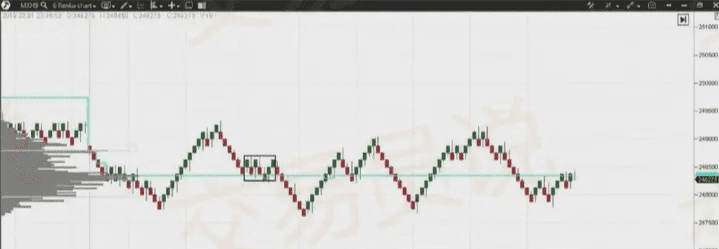
Buyers and sellers engaged in a fierce battle at the highest trading volume level. Ultimately, the sellers overwhelmed all the buyers' strength, and the price continued to fall. It's important to note that consolidation patterns are very common in sluggish, range-bound markets, where relying solely on trend patterns for trading often proves ineffective.
3. Spring and upward stroke
The spring-like pattern points downwards, while the upward surge points upwards. In fact, both of these patterns represent false breakouts of local highs or lows. These patterns are often market "tricks" designed to trigger stop-loss orders.
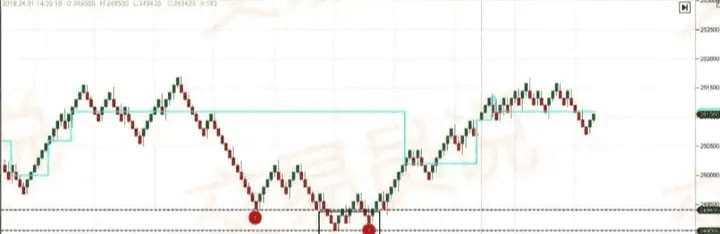
When the price fell at point 1, the trading volume surged to 20,302 lots, creating a new intraday low. Points 2 and 3 showed false breakouts of this low, but the trading volume decreased to 1,943 lots and 820 lots respectively, while the lows gradually rose. The wave chart showed wave contraction and a divergence between price and wave patterns.
The possible process is as follows:
1. Intraday panic;
2. The appearance of a spring triggered stop-loss orders from "aggressive bulls" who bought at the panic lows;
3. Decreasing volume during a downtrend indicates a lack of interest in further declines; the next uptrend will show green volume on the Wes Wave indicator, indicating genuine buying demand.
The trader added, "The 'spring' pattern, a term coined by Wyckoff, describes a price movement that moves in the opposite direction to the subsequent breakout. In hindsight, a spring may appear as a false breakout, but when it occurs, it can induce traders to trade in the wrong direction. Institutional traders use springs to accumulate buy orders and then push prices up."
David Weiss believes that a trader who is proficient in the "spring" trading method can earn "lunch money" on a 5-minute candlestick chart. If one is proficient in the spring trading method, one can make a living from trading. The "spring" trading method is suitable for both short-term and medium- to long-term trading.
The so-called "spring" trading method involves large funds testing the market before driving up prices. They assess the amount of profitable shares held by retail investors and the potential selling pressure. This is done by briefly testing a visible support level, causing panic among retail investors. The strength of the selling pressure is then observed. If the selling pressure is weak (low volume), the large funds can aggressively push up the price. If the selling pressure is strong, they continue to shake out weak hands until retail investors exhaust their selling pressure before further price increases. This rapid price breakout and subsequent rise is called the "spring effect," and entering the market at this point is called "spring trading."
4. Great effort, small reward
If we consider trading volume as "effort" and price movement as the "result," then a huge trading volume that yields only a tiny price change means that the effort has been wasted. The Brent crude oil futures chart mentioned above (Figure 3) provides a clear example of the contrast between a small return and a large effort.
5. Mobility
Weiss Wave describes "volatility" as a smooth and steady rise in price accompanied by increased trading volume. This indicates a strong current trend. In candlestick charts, this is represented by an opening price near the lowest point and a closing price near the highest point. This scenario was illustrated in the savings bank stock futures chart (Figure 2) above.
6. Wave Reduction
The current wave is shrinking in both length and volume, while the reverse wave is gradually growing, which is often a signal that the trend is about to reverse.
In the chart, downward waves are marked with red numbers, and upward waves with green numbers. Divergence appears in the wave chart; although green wave number 1 does not exceed the previous red wave, it is larger than the previous green wave. Subsequently, the red wave shrinks, indicating that the short-term trend is about to change. Overall, the market was still in a downward trend that day, with only brief rebounds interspersed.
7. Deviation
A divergence occurs when prices reach new highs/lows, but the price action does not simultaneously reach new highs/lows.
Note: Divergence often indicates that the previous trend is slowing down, but it takes time for the trend to truly stop and reverse. The first red wave in the chart above shows that each time the price makes a new low, the wave gradually shrinks, suggesting weakening momentum and a possible short-term reversal.
8. Breakthroughs and tests at key junctures
The market doesn't always retrace immediately after a breakout; sometimes it may rise steadily until the first correction occurs. Typically, trading volume decreases during the test.
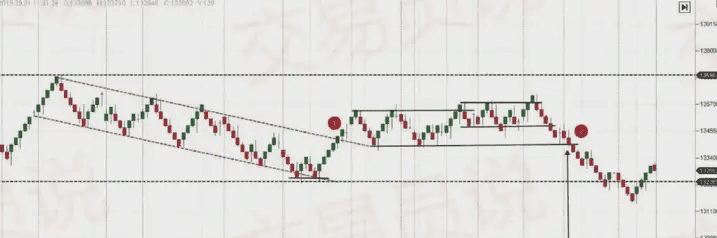
From January 11th to 29th, prices traded within the range indicated by the black dotted line. At point 1, buyers broke through the previous downtrend with increased volume (marked by the red dotted line). A subsequent downward wave tested this breakout area.
From point 1 to point 2, the price entered a consolidation phase. At point 2, sellers broke through the consolidation zone with increased volume. The increased volume that led to the breakout is indicated by arrows on the chart. Although the chart does not show that the breakout level at point 2 was tested, traders must pay closer attention to potential trading opportunities as the market approaches this level.
How to trade effectively using the Wes Wave indicator
As we mentioned before, trading using technical analysis is inseparable from trends, and the same applies to trading using Wesleyan waves. This is the premise: trading based on trends. Below, we will explain two main trading strategies for traders' reference and learning.
Strategy 1: Trade based on the trend signals of the Wes Wave indicator.
This strategy is very simple; you only need to observe the Wes Wave indicator to trade.
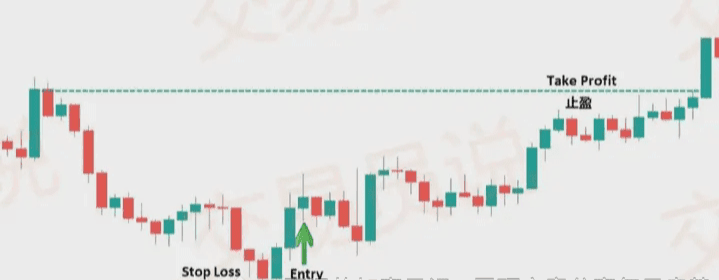
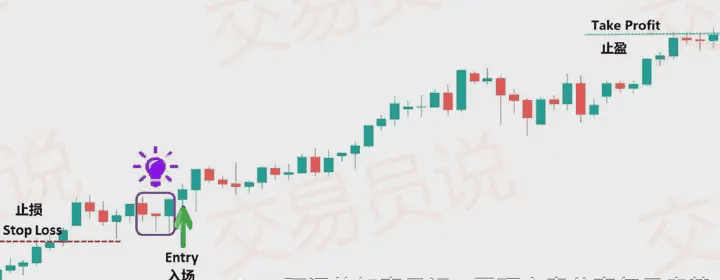
Using the Wes Wave indicator to make long trades, as shown below:
Entry point: When the Weiss Wave indicator histogram turns from red to green. On the trading chart, when a strong bullish candlestick appears in a downtrend.
Stop-loss point: the nearest support level before the price rebounds.
Take profit point: When the price touches the previously formed resistance level, you should take profit (or you can determine where to take profit based on your own risk tolerance).
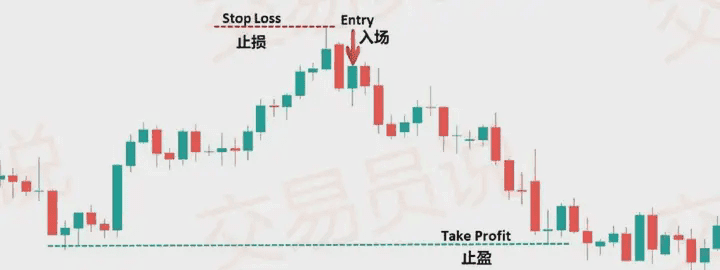
Using the Wes Wave indicator for short selling is shown below:
Entry point: When the Weiss Wave indicator histogram turns from green to red. On the trading chart, when a strong bearish candlestick appears within an uptrend.
Stop-loss point: the nearest resistance level before the price rebounds.
Take profit point: When the price touches the previously formed support level, you should take profit (or you can determine where to take profit based on your own risk tolerance).
Strategy 2: Wesley Wave Indicator Combined with Reversal Candlestick Pattern
Here we will discuss two reversal candlestick patterns: the Morning Star and the Evening Star. Statistically, these two candlestick patterns are the most reliable signals of trend continuation. Specifically, in an uptrend, when a Morning Star candlestick pattern appears, the uptrend is likely to continue; in a downtrend, when an Evening Star candlestick pattern appears, the price may fall further.
Using the Wes Wave indicator to make long trades, as shown below:
Entry point: When the Weiss Elliott Wave indicator histogram turns green, the price is in an uptrend, and a Morning Star candlestick pattern appears. After the Morning Star pattern completes, you can immediately enter a long position.
Stop-loss point: the nearest support level before the morning star candlestick pattern appears.
Take profit point: When the price touches the previously formed resistance level, you should take profit (or you can determine where to take profit based on your own risk tolerance).
Using the Wes Wave indicator for short selling is shown below:
Entry point: When the Wesley Wave indicator histogram turns red, the price is in a downtrend, and a Evening Star candlestick pattern appears. Short positions can be entered immediately after the Evening Star candlestick pattern completes.
Stop-loss point: the nearest resistance level before the Evening Star candlestick pattern appears.
Take profit point: When the price touches the previously formed support level, you should take profit (or you can determine where to take profit based on your own risk tolerance).
Common Wesley Wave Trading Methods
Overall, the method of opening positions using Weiss waves is consistent with classic trading principles, mainly differentiated based on the current market environment.
Trading methods:
In a trending market, enter the market on the next candlestick after a new high/low. In a trending market, waves may continue to extend without correction.
In a range-bound market – when the momentum of the waves shortens and wave divergence occurs, sell at the day's high and buy at the day's low.
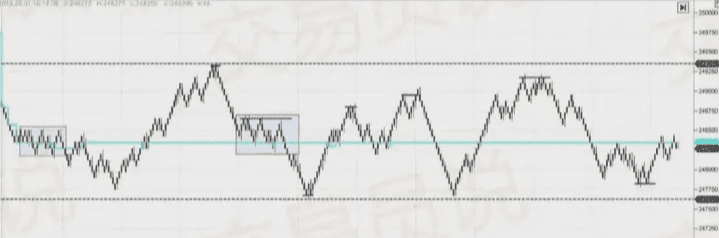
The chart uses dashed lines to mark the day's high and low points; the dynamic level indicator shows the movement of the maximum trading volume level. Green arrows represent upward waves, and red arrows represent wave divergences. Rectangular areas mark consolidation ranges; once these areas are broken, the market will begin a directional trend. Solid black lines mark short-term support/resistance levels when double tops, triple tops, double bottoms, or triple bottoms are formed. Using Wesley waves, this chart is simplified, intuitive, and clear.
Advantages and disadvantages of the Wys wave indicator
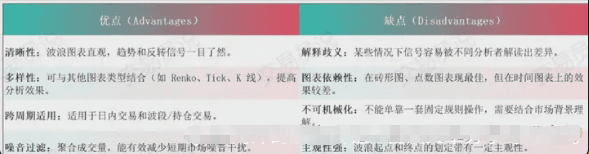
“I call it the ‘moment of awareness,’ when you sense a market move is about to happen, and that realization drives you to take immediate action.” — David Weiss
Summarize
Trading begins with supply and demand, and the Wyss wave indicator also originates from the combination of wave charts and trading volume. This concept was first proposed by Wyckoff in his research in the early 20th century to summarize and analyze each fluctuation.
As we mentioned before, trading using technical analysis is inseparable from trends, and the same applies to trading using Wesley's wave indicator. This is the premise: trading based on trends. The Wesley's wave indicator is one of the most stable and accurate indicators for identifying trends.
In addition, no trading strategy is 100% effective. It is recommended to test the indicator in a demo account before engaging in live trading and familiarize yourself with its usage.
A must-read for cryptocurrency futures beginners! Three core strategies
1. The most important principle: Stop loss! Stop loss! Stop loss!
What it is: Set up an "automatic escape pod" for your trades. When the price falls to a certain level, the system will automatically close your positions, helping you lock in losses and preventing them from escalating indefinitely.
Why: Contracts are leveraged; a single extreme market move without a stop-loss order could wipe out your entire capital. Not setting a stop-loss is gambling, and a gamble with an extremely low probability of success.
How to do it: The first thing to do after opening an order is to immediately set a stop loss! Depending on your position size and the range of losses you can tolerate, treat it as naturally as breathing.
2. The core principle: Use small positions! Use small positions! Use small positions!
What it means: Don't put all your funds into a single order, and don't use leverage of 10x, 20x, or even higher all the time.
Why: High leverage combined with heavy positions can lead to huge losses or even a margin call, even with a small fluctuation. The heavier the position, the easier it is to lose emotional balance, and the more distorted the trading decisions will be.
How to do it: Beginners are advised to start practicing with extremely low leverage of 1-3 times and a very small position of 1%-5%. First, experience the market fluctuations; only by surviving can you have a chance to capture the next big market move.
3: Core Skill: Review! Review! Review!
What it is: Regularly review every trade you make, whether you win or lose. Analyze why you made a profit or a loss.
Why: Making money might be luck, but consistently making money definitely requires skill. Only through reviewing past performance can you turn luck into replicable strategies and avoid repeating the same mistakes.
How to do it: Record your reasons for opening a position, your exit point, the profit or loss result, and your mindset at the time. Spend time reviewing these records each week, and you'll improve rapidly.
One last piece of advice: The futures market is ruthless; "slow and steady wins the race." Don't fantasize about getting rich overnight; that's 99% a trap. First, use small amounts of capital and low leverage to master the three points mentioned above, preserve your principal, and you'll be one of the few players who can make money.
Trading is not about getting rich overnight, but about making reasonable profits that can be sustained, stable, sustainable, and with a high probability of success, so that one can continuously acquire wealth.
Professionalism creates value, and details determine success or failure. If you're currently feeling helpless or lost while trading in the cryptocurrency market, I hope my sharing can offer some inspiration and help!
Wenjing is focusing on spot trading of Ethereum futures contracts; the team still has spots available, so get on board quickly! #美SEC推动加密创新监管 $ETH