Bitcoin paused temporarily
The price of Bitcoin started a new rise above the $92,500 level. BTC is now consolidating its gains and may attempt a bullish breakout above $93,500.
Bitcoin began a new increase above the $92,500 area. The price is currently trading above $92,000 and the simple moving average for the hour is 100. There was a break below an upward trend line with support at $93,000 on the hourly chart for the BTC/USD pair (data from Kraken). The pair may continue to move upward if it stabilizes above the $93,000 area.
The price of Bitcoin faces resistance
The price of Bitcoin managed to stay above the $90,000 area and began a new increase. BTC gained strength to move above the levels of $90,500 and $91,500.
There was a clear move above the resistance at $93,000. A peak was formed at $94,050, and the price is now consolidating the gains. There was a slight decline to test the 23.6% Fibonacci retracement level for the upward move from the swing low of $83,870 to the swing high of $94,050.
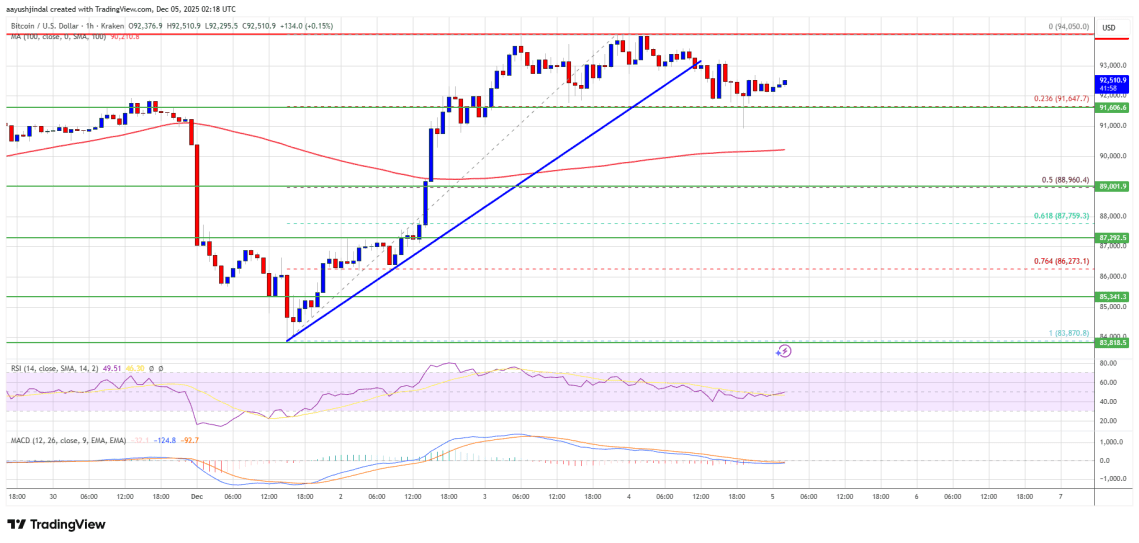
There was a break below an upward trend line with support at $93,000 on the hourly chart for the BTC/USD pair. Bitcoin is currently trading above $92,000 and the simple moving average for the hour is 100.
If buyers remain active, the price may attempt another increase. Immediate resistance is near the $92,800 level. The first main resistance is near the $93,000 level. The next resistance may be at $94,000. Closing above the resistance at $94,000 could push the price higher. In this case, the price may rise and test the resistance at $95,000. Any further gains could push the price towards the $95,500 level. The next barriers for buyers may be at $96,200 and $96,450.
Will there be a decline in BTC?
If Bitcoin fails to rise above the resistance area of $94,000, it may begin another decline. Immediate support is near the $91,650 level. The first main support is near the $90,500 level.
The next support is now near the $88,950 area or the 50% Fibonacci retracement level for the upward move from the swing low of $83,870 to the swing high of $94,050. Any further losses could push the price towards support at $87,750 in the near term. The main support is at $87,200, below which a decline could accelerate BTC's drop in the near term.
Technical indicators:
* Hourly MACD: The indicator is now losing momentum in the bullish area.
* Hourly RSI (Relative Strength Index): The RSI for the BTC/USD pair is now below the 50 level.
* Main support levels: $91,650, followed by $90,500.
* Main resistance levels: $93,000 and $94,000.
@Binance Square Official @Binance Africa $BTC
