Alright team, let's break down this juicy XRP chart and see what's cooking. The daily chart is signaling massive potential after a significant technical bounce.
### Technical Analysis
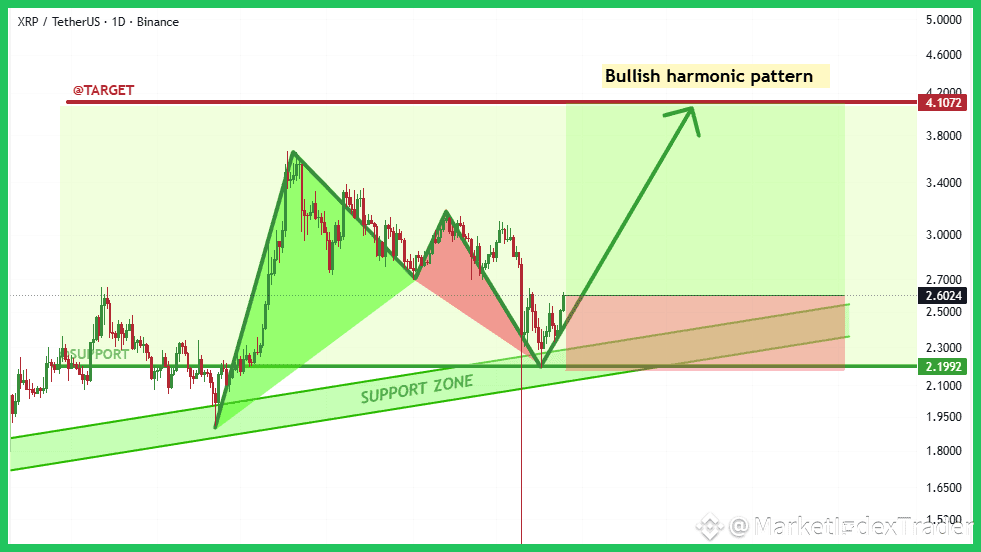
We are seeing a textbook completion of a major Bullish Harmonic Pattern on the D1 chart. The price perfectly tagged the primary support zone (PRZ) around $2.20. This setup strongly suggests that the recent selling pressure has exhausted its momentum, marking a high-probability reversal point. Immediate resistance lies near the current price action, specifically between $2.60 and $2.75. A decisive close above this level confirms the pattern activation, opening the path toward the major historical target, which sits clearly marked at $4.10.
### Fundamental Analysis
Fundamentally, XRP looks stronger than ever. The continuous advancement in regulatory clarity regarding its status, especially outside the U.S., combined with Ripple's ongoing expansion of its On-Demand Liquidity (ODL) payment corridors globally, provides robust support for future institutional adoption and price stability. The project continues to build real-world utility.
### Action Plan
My strategy is to accumulate XRP on any minor pullbacks toward $2.40, targeting the ambitious $4.10 level for mid-term profits. Maintaining a stop-loss order below the $2.15 support is crucial for risk management.
Highly recommend HOLD and Stacking XRP at Binance
Feel free to comment the altcoin you are holding and we will check it for you!


