Analysis from the Perspective of Wyckoff Theory (BTC/USDT Daily Chart)
1. Macroeconomic Orientation (SCHO Stage)
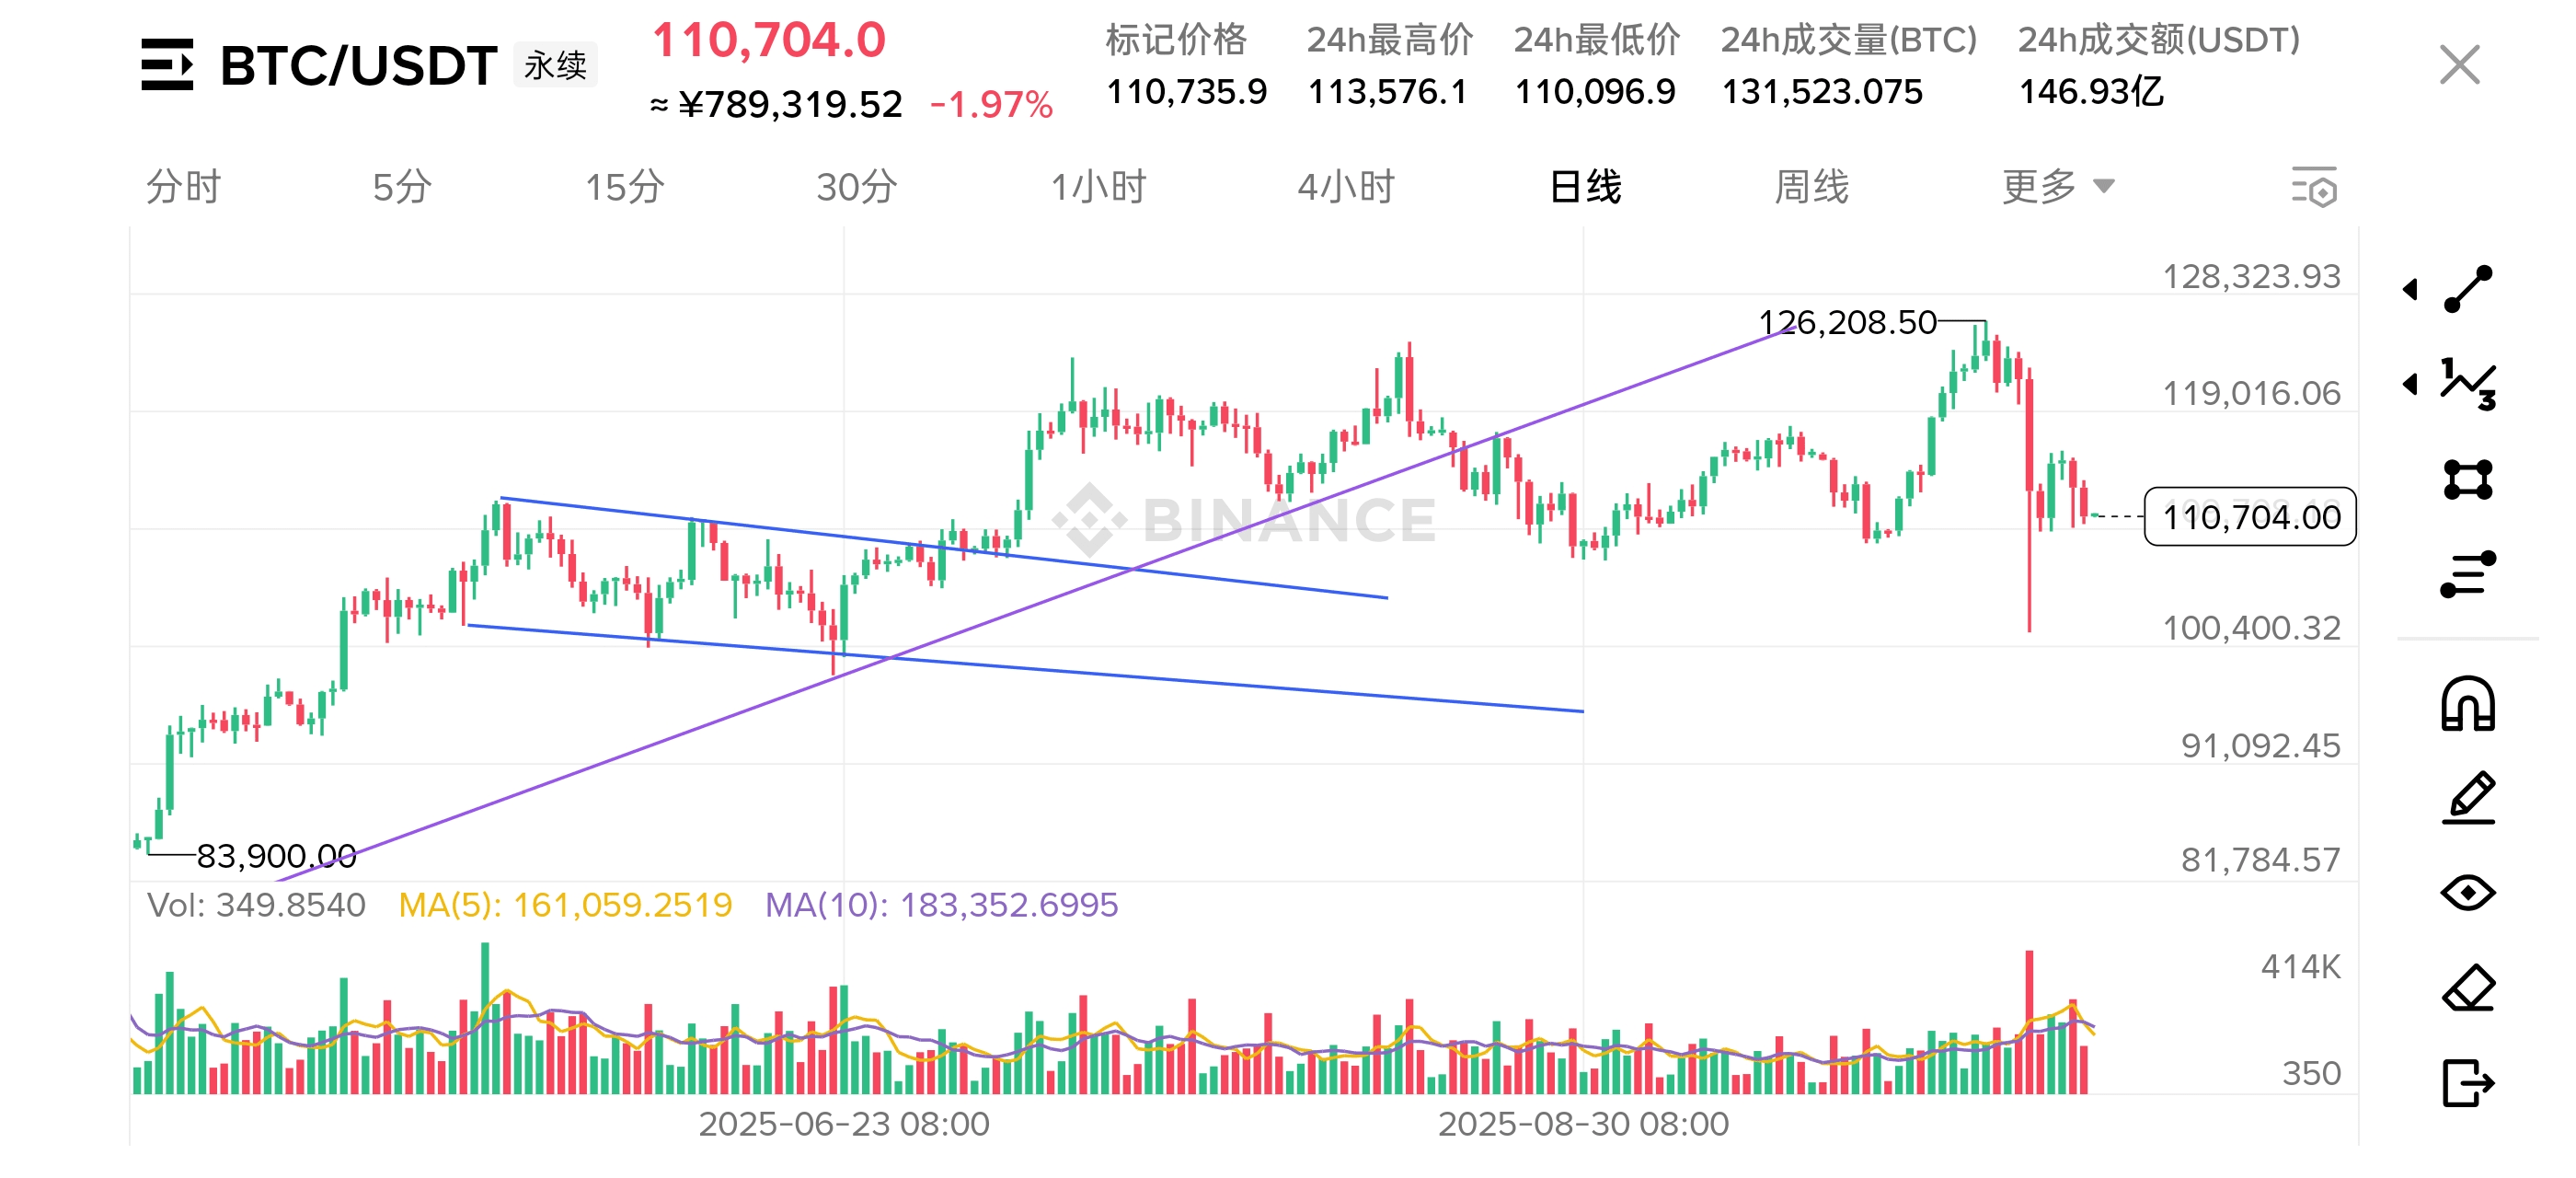
Chart shows the structure of 'Long-term Rise (Markup) → High-level Plunge Adjustment': an upward trend starting from 83,900 (consistent with Markup characteristics, with previous low-level fluctuations for accumulation), peaking at 126,208.50 before experiencing a 'waterfall' adjustment. Currently in a deep adjustment phase after the upward trend, need to be cautious whether it enters the initial stage of Distribution (due to significant adjustment that has damaged the trend structure).
2. Micro Analysis (Key Signals and Price-Volume Relationship)
1. Trend Structure and Extreme Points:
The pattern of 'higher lows, moving along the trend line' in an uptrend had been effective, but recently the price broke below the uptrend line and key support (the lower edge of the previous consolidation platform), forming a 'trend destruction' signal.
During the pullback, trading volume significantly increased (corresponding to the massive volume of the dive), consistent with the 'strong effort (massive selling pressure) leading to strong results (deep decline)', implying that short-term supply is overwhelmingly dominant.
2. 'Effort and Result' Law Verification:
When the price surged to 126,208.50, there was no 'extreme explosion' in trading volume; the subsequent dive showed a trading volume far exceeding that during the previous uptrend, indicating 'supply suddenly exploding, demand insufficiently supporting', which is a typical volume-price characteristic of Distribution or the early stage of trend reversal.
3. Comprehensive Assessment
Currently in a deep adjustment phase after Markup, with signs of entering the early stage of Distribution. The signal strength is 'strong'—the trend line and key support have been breached, and the pullback volume exhibits 'supply dominance' characteristics, indicating that the core structure of the uptrend has been damaged.
4. Action Plan (Personal Opinion Only, Not Investment Advice)
1. Scenario Forecast:
Scenario 1 (Rebound Faces Resistance and Continues to Adjust): If the price rebounds to near 119,016 (previous support becoming resistance) under pressure, and the trading volume does not increase significantly to break through, it is likely to continue adjusting, possibly testing deeper support (such as 100,400 or previous low of 83,900).
Scenario 2 (Breakthrough Resistance to Repair Trend): If the price breaks through 119,016 with significant volume (trading volume significantly exceeding the average volume during the pullback), the short-term downtrend may pause, entering the 'Trend Repair' phase, but caution is needed to determine whether it is a 'rebound during distribution' or a 'trend restart' (requires subsequent volume and price validation).
2. Key Positions and Operations: (Personal Opinion Only, Not Investment Advice)
- Entry:
‘Primarily Wait and See’: The current supply dominance is evident, and aggressive longs are not recommended; if betting on a rebound, a small long position can be tried when the price pulls back to the 105,000 - 110,000 range with low volume (betting on a short-term oversold rebound).
- Stop Loss:
Try to enter long: Stop loss below 100,000 (to guard against deep breakdown risk).
- Target:
First target for rebound: 119,016 (test resistance); if it breaks, then look at the 123,000 - 125,000 range (near previous highs).
Simplified Operational Suggestion: Primarily wait and see, with opportunities for high shorts (Personal Opinion Only, Not Investment Advice)
Short-term cautious, prioritize watching the resistance at 119,016. If the price pulls back to stabilize with low volume in the 105,000 - 110,000 range, a small long position can be tried, stop loss at 100,000, with a target of 118,000 - 119,000; if it rebounds to 119,016 under pressure, consider a small short position after taking profits on the rebound, stop loss at 120,000, with a target of 108,000 - 105,000.
