🕒 Daily Time Frame Overview
Bitcoin has shown a strong recovery from Friday’s crash low. Depending on the exchange, the actual low varies slightly:
Binance: $107,550
Coinbase: $107,090
My chart: around $105,120
While these differences might seem minor, for some altcoins, the discrepancy between exchanges is massive — making technical analysis more complex.
🌀 Elliott Wave Perspective: Wave 4 Flat Correction
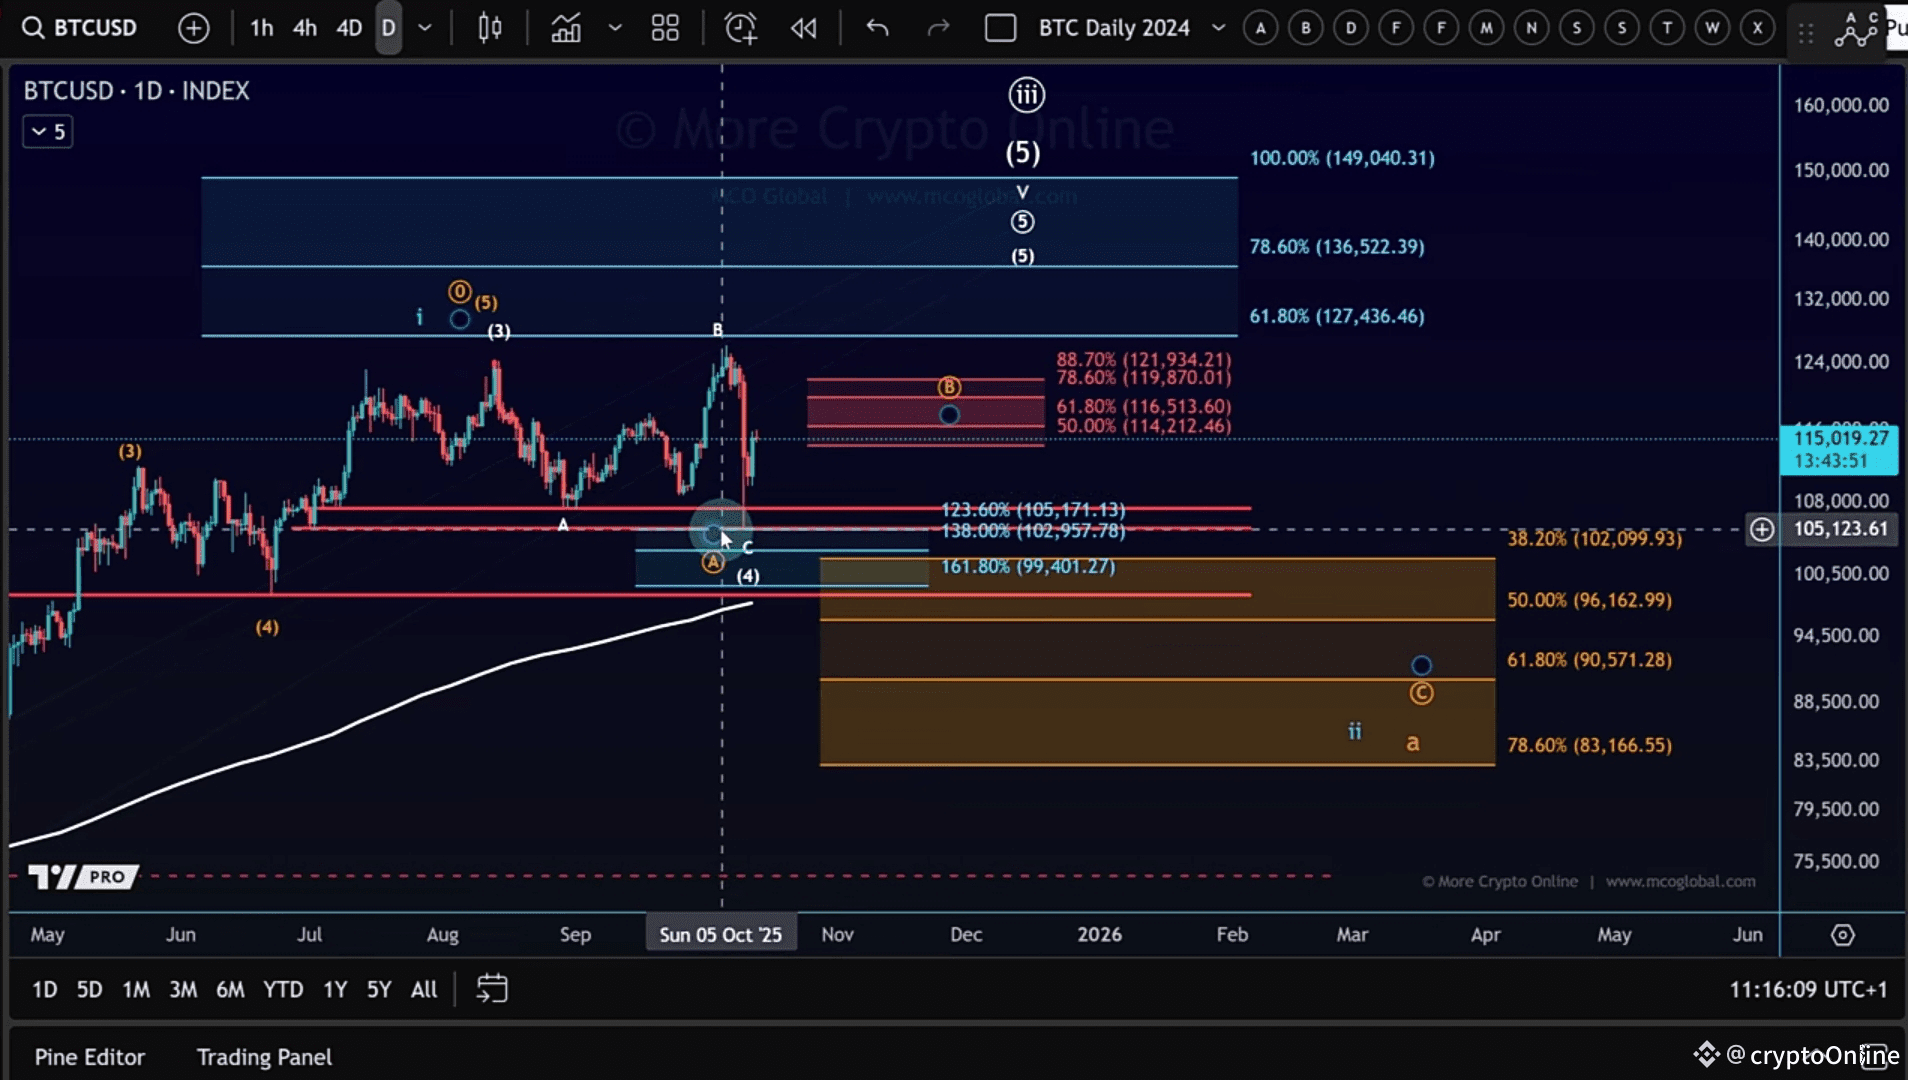
From an Elliott Wave standpoint, this structure still fits a Wave 4 expanded flat scenario.
We can label it as:
A-wave: the initial drop
B-wave: the recovery
C-wave: the recent decline into support
The C-wave landed in the standard target area between $105,170 and $99,400, forming a double bottom on some exchanges — a valid flat correction setup.
📈 Resistance & Support Zones to Watch
The current resistance zone lies between $114,212 and $121,934 — already being tested.
If Bitcoin pushes higher, it could signal that Wave 4 has completed.
However, if this move up forms only three waves, a final C-wave down remains possible (orange count scenario).
Key Levels:
Immediate Support: $113,569
Major Resistance: $117,300 → $119,480
Upper Resistance Range: $121,934
⚙️ Scenario Analysis
1️⃣ White Count (Primary Bullish Scenario):
Wave 4 may have already completed. If Bitcoin holds current support and forms a 5-wave micro impulse up, the next target could extend beyond $120K.
2️⃣ Orange Count (Corrective Scenario):
The ongoing move could still be a B-wave, leading to a deeper C-wave correction before setting up a potential 1–2 bullish structure for the next cycle leg.
