Fans often ask me why the same candlestick patterns make others money while I lose money? The answer is simple: you only remember the shape but haven't understood the market sentiment and intentions behind it.
I have been in the cryptocurrency world for years, starting with just a few thousand dollars, making a living from trading not by predicting the future, but by using candlestick patterns as a 'dominant language' to assess probability advantages. Today, I want to share with you the (34 classic candlestick patterns practical essentials) that helped me advance my assets after my improvements and practices. This is not just a pattern manual; it's also a 'market reasoning handbook' that teaches you how to think.
One, Core Principles: Understanding the Bull-Bear Struggle Behind Candlesticks
Before you memorize any patterns, you must understand one core concept: each candlestick is a 'battle scar' left by the struggle between bulls and bears over a certain period.
· Body: Represents the difference between the opening price and the closing price, is the ground ultimately occupied by either the bulls or bears. The larger the body, the stronger the force of one side.
· Shadow line: Represents the extreme positions tested by price during the period, left as 'battle scars' after an offensive is blocked. A long upper shadow indicates that bulls were pushed back by bears; a long lower shadow indicates that bears were supported by bulls during the downward test.
Remember, believing in candlesticks is not simply trusting their shapes, but believing in the 'changes in power dynamics' they reveal.
Two, Single Candlestick: A Microscope to Peek into Market Sentiment
Don't underestimate the simplicity of a single candlestick; it can send strong warning signals at critical positions.
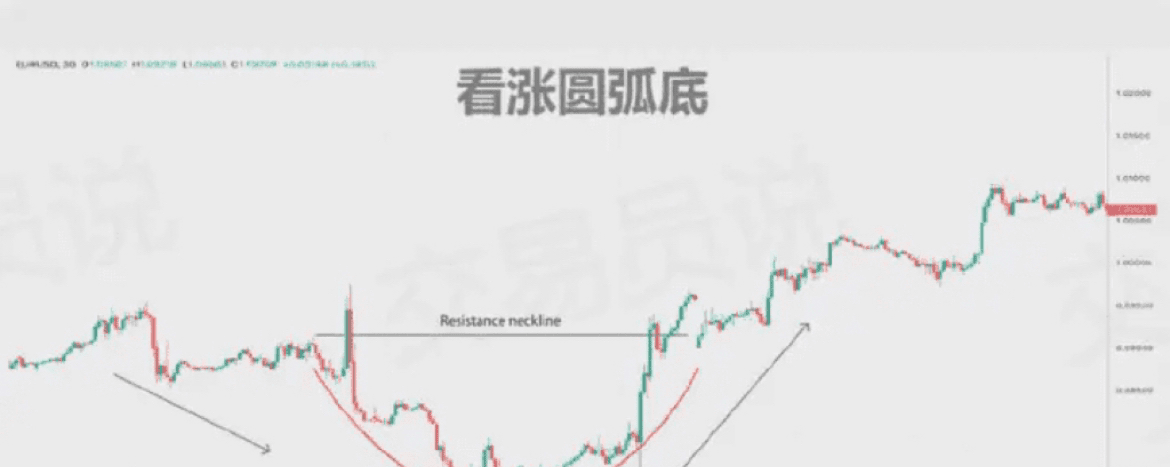
1. Hammer:
· Appearance: Appears in a downtrend, with a small body and a long lower shadow, resembling a hammer.
· Meaning: The price once sharply declined but was strongly pulled back by the bulls to close at a high. This is the first signal that the downtrend may be losing strength, and the bulls are starting to counterattack.
· Practical points: The longer the lower shadow, the stronger the signal. A subsequent bullish line is needed for confirmation.
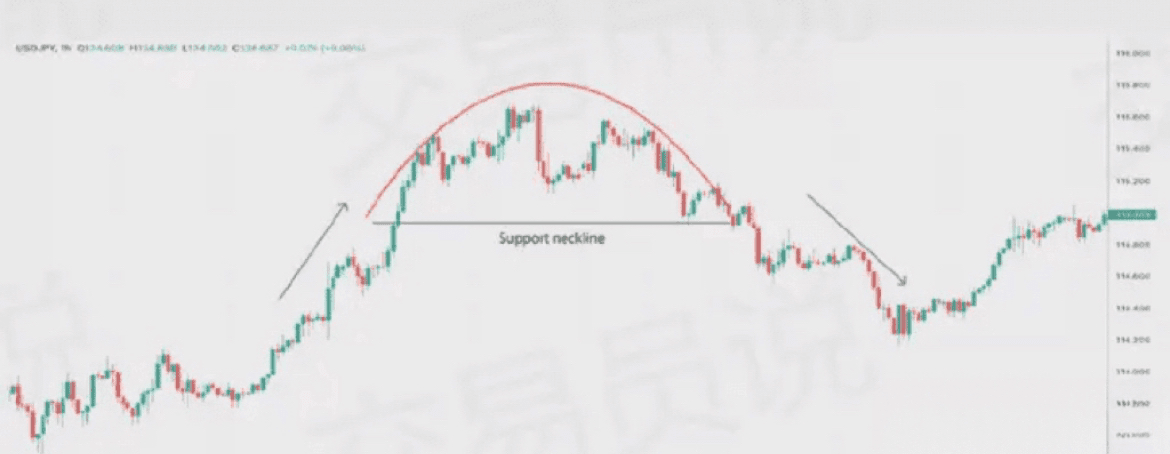
2. Hanging Man:
· Appearance: Looks exactly like a hammer, but appears at the top of an uptrend.
· Meaning: Although the close is acceptable, the bulls have lost their strength to push, and the bears have significantly suppressed the price. This is a signal of trend weakness and the danger of betrayal within.
· Practical points: When you see it, at least you should not open new long positions and should consider reducing your positions.
3. Shooting Star:
· Appearance: Appears in an uptrend, with a small body and an extremely long upper shadow.
· Meaning: The bulls once pushed the price to soar but were met with a counterattack from the bears, causing a significant price drop. This is a clear top reversal signal, indicating heavy selling pressure above.
· Practical points: The longer the upper shadow, the more pronounced the reversal implication. Usually accompanied by massive trading volume.
Three, Two-Candlestick Combinations: The Code to Confirm Trend Reversals
A single candlestick may be false, but the combination of two candlesticks can greatly enhance the reliability of the signal.
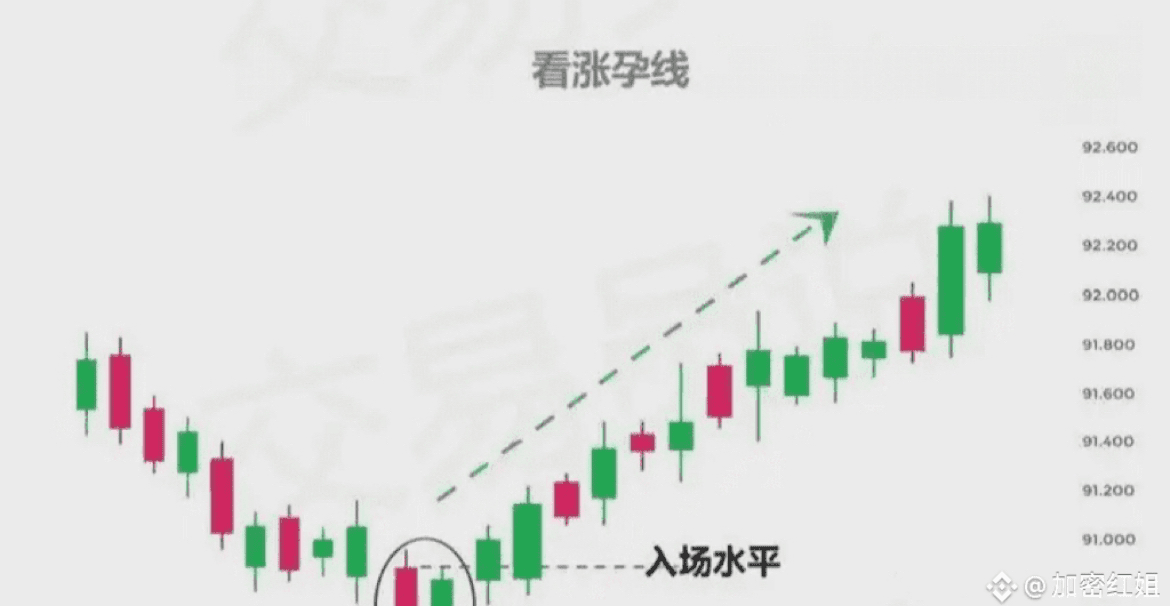
1. Bullish Engulfing:
· Appearance: In a downtrend, the first line is a bearish line, and the second bullish line completely engulfs (covers the body) the first line's body.
· Meaning: After the market opens the next day, the bulls completely crush the bears from the previous day, indicating a strong bottom reversal signal.
· Practical points: The larger the engulfing bullish line's body and the higher the trading volume, the more reliable the signal.
2. Bearish Engulfing:
· Appearance: Opposite to the bullish engulfing, in an uptrend, the first line is a bullish line, and the second bearish line completely engulfs the body of the first.
· Meaning: Bearish strength completely overwhelms bulls, it is a strong top reversal signal.
· Practical points: When this pattern appears at a high in a bull market, it requires heightened vigilance.
3. Dark Cloud Cover:
· Appearance: In an uptrend, the first line is a large bullish line, the second line is a large bearish line that opens high and closes low, with the bearish line's closing price deeply penetrating below 1/2 of the first bullish line's body.
· Meaning: A strong open the next day should indicate strength, but it is immediately suppressed by the bears, causing market sentiment to plummet.
· Practical points: The deeper the penetration, the greater the possibility of reversal.
Four, Three and Multiple Candlesticks: Capturing Large Market Movements
These patterns take longer to brew, and once formed, they guide larger market movements.
1. Morning Star:
· Appearance: The 'Hope Three-In-One' at the end of a downtrend. The first line is a large bearish line (despair), the second line is a small star line (hesitation, can be bearish or bullish, represents balance between bulls and bears), and the third is a large bullish line (hope), cutting into the body of the first bearish line.
· Meaning: A classic and strong bottom reversal pattern. The star line represents a 'pause in the trend', while the bullish line signifies 'the beginning of a new direction'.
2. Evening Star:
· Appearance: Opposite to the Morning Star, it is a 'Warning Three-In-One' at the top of an uptrend. The first line is a large bullish line (euphoria), the second is a small star line (hesitation), and the third is a large bearish line (collapse).
· Meaning: A classic and strong top reversal pattern. Seeing it is a signal for profit-taking or considering going short.
3. Three White Soldiers:
· Appearance: After a bottom or consolidation, three consecutive medium to large bullish lines appear, with each opening price located within or near the previous line's body, continuously reaching new highs.
· Meaning: Steady and continuous buying power is a signal for a healthy upward trend to begin.
Five, Continuation Patterns: How to Jump on the Trend Midway
The market does not always rise or fall; it needs to rest in between, and rest is for moving further.
1. Bullish Flag / Pennant:
· Appearance: After a rapid rise (flagpole), the price enters a small downward sloping channel (flag) or symmetrical triangle (pennant) for consolidation.
· Meaning: This is a normal pullback caused by profit-taking, but the main force has not exited. Once the consolidation ends, the price will continue the previous upward trend.
· Practical points: When the upper boundary of the pattern is broken, it is an excellent point to enter midway.
Ultimate Principles and Reminders
1. Position is Greater than Pattern: The same bullish pattern appearing at the top of a mountain and at the foot of a mountain has completely different meanings. It must be judged in conjunction with the trend and position.
2. Trading Volume is the Soul: Any important breakout or reversal must be confirmed by trading volume. Without volume support, the credibility of the pattern is significantly reduced.
3. There is No 100% Holy Grail: Candlestick patterns offer a probabilistic advantage. Strictly adhering to the discipline of 'stop loss if the pattern fails' is more important than pursuing a perfect pattern.
4. Simplifying Complexity: You don't need to memorize all 34 patterns. Start with the 10 most classic and frequently occurring ones, observe and verify them repeatedly in real trading until you develop a 'market sense', which is far more useful than just theoretical discussions.
In the cryptocurrency market, which has extreme information asymmetry, candlestick charts are one of the few pieces of public information that are fair to all traders. Learning to interpret them means you are no longer a gambler relying solely on intuition, but you start trading like a 'professional player' using logic and probability.
@金爷加密 leads you step by step towards financial freedom, achieving win-win together❗️
In this battle between retail investors and institutional players, understanding candlesticks is the first decent weapon you pick up.