If you have ever entered a trade just because you saw someone post "🚨 Breakout confirmed, it’s going up!" in the Binance feed (or in signal groups), this article is for you.
Often, signals are correct, but not at the time users imagine. This generates anxiety, losses, and even the false sensation that "the signal failed." In fact, what is lacking is the understanding of the market structure.
And this is where the famous Elliott Waves come in.
🌊 What are the Elliott Waves?
Elliott's Theory shows that the market does not move randomly, but in repetitive patterns of waves.
These waves follow a psychological cycle of investors: greed, euphoria, fear, and panic.
📌 Main structure:
5 impulse waves (main trend)
3 corrective waves (against the trend)
In other words, first the price advances in 5 movements, then breathes in 3 movements. This repeats in different time scales.
🔍 Waves within waves
Something essential: within each larger wave, there are mini-waves.
For example:
• Wave 3 (usually the strongest of all) may contain 5 mini-impulses within it.
Wave 2 (corrective) may contain a sequence of 3 smaller movements.
This means that when you look at a 4-hour chart, you might be seeing a wave that, on a 15-minute chart, has a whole new Elliott structure unfolding.
👉 It’s like a fractal: patterns within patterns.
⏳ The timing of confirmation matters
Here is the point where many signal followers get lost: not every wave is ready to be traded.
Before "diving in headfirst," you need to wait for confirmations, and this is where the Fibonacci rule comes in.
Practical examples:
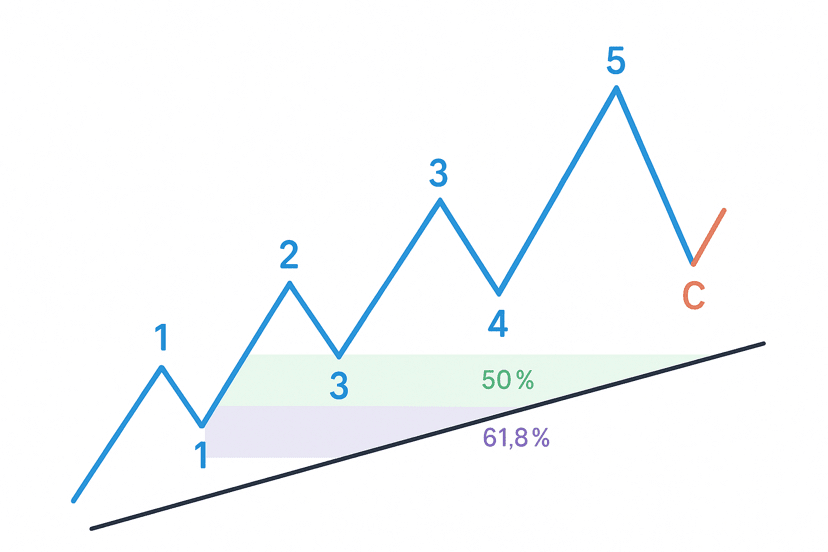
Wave 2 usually corrects 50% to 61.8% of wave 1.
🔑 This means that instead of buying on the first pullback, you wait for the correction to reach this Fibonacci zone to validate your entry.Wave 4 usually corrects 38.2% of wave 3.
🔑 If you enter too early, you might get "stopped out" before the right time.Wave 3 is almost always the longest.
🔑 If you identify its confirmation early, that’s where the profit is usually higher.🎯 Why does this matter for those who follow signals?
Because the market will always be within a wave.
When someone posts a signal, it may be correct — but if the price has not yet reached the Fibonacci zone, or if the wave is not confirmed yet, the movement may take time or even reverse in the short term.
👉 In other words, the signal itself may be good, but without the context of Elliott, you don’t know at what moment of the wave you are entering.
⚖️ Summarizing the advantages of understanding Elliott:
✅ You don’t enter signals at the wrong time.
✅ Learn to wait for Fibonacci confirmations.
✅ Understands that each wave can contain new waves (thus avoiding frustration over time).
✅ You gain autonomy instead of blindly relying on signals.
🚀 Conclusion
Elliott Waves are not magic — they are collective psychology applied to the chart.
If you already trade by following signals, start observing the larger context: in which wave is the price now? At what Fibonacci point is the correction?
📊 With this knowledge, each signal that appears in your feed ceases to be just a "bet" and becomes part of a larger market puzzle.
Here is the chart of Elliott Waves applied to the cryptocurrency market 📊:
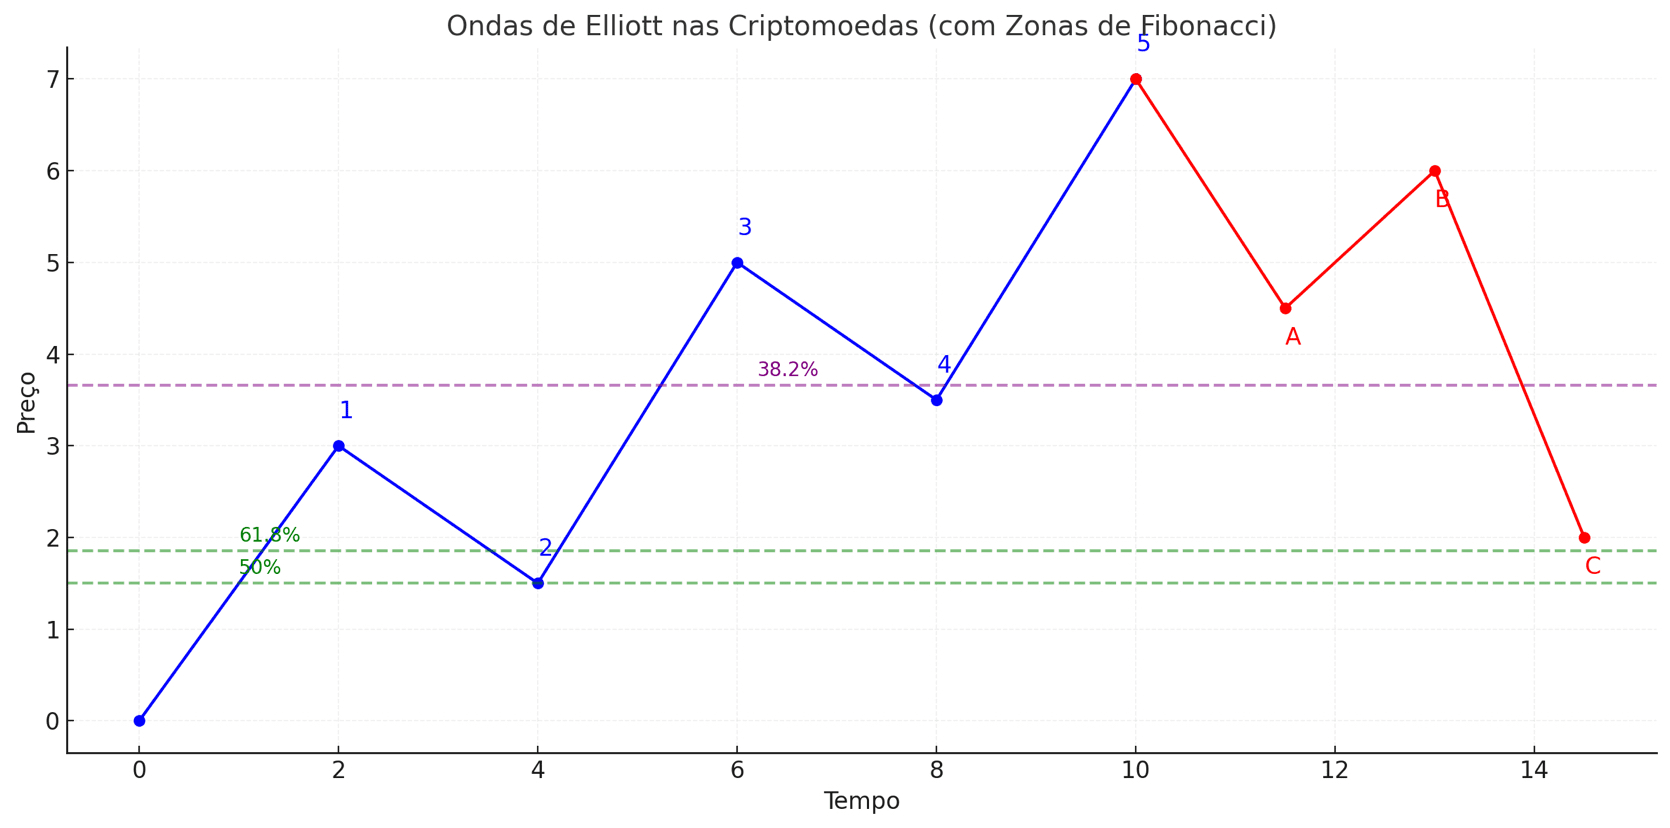
In blue: the impulse waves (1 to 5).
In red: the corrective waves (A-B-C).
In green and purple: Fibonacci zones (50% and 61.8% for wave 2; 38.2% for wave 4).
The heart of Elliott Wave Theory is the collective psychology that drives the market. In other words, each wave is not just price going up or down, but a reflection of mass human emotions — greed, hope, fear, euphoria, panic.
📊 The Emotions Behind Each Elliott Wave
1️⃣ Wave 1 — Hope
The market was falling, but some attentive investors notice that the price has dropped too much, and a timid upward movement begins to emerge.
😌 Emotion: Cautious optimism. Few still believe.
2️⃣ Wave 2 — Doubt
The price corrects and many think: "It was just a breather, it will still fall more."
😟 Emotion: Fear and uncertainty. The market tests patience.
3️⃣ Wave 3 — Euphoria
It’s the strongest wave. Now everyone sees that "the market really turned around." The news becomes positive, analysts point to a rise, traders and beginners start to enter en masse.
🤩 Emotion: Confidence and greed. The feeling is that "it will go up forever."
4️⃣ Wave 4 — Realism
After euphoria, comes a pause. Many take profits, the price corrects a bit. Still, few believe that the trend is over.
😅 Emotion: Caution. Some get nervous, but still trust the rise.
5️⃣ Wave 5 — Overconfidence
The price goes up again, but with less strength than in wave 3. Many beginners enter late thinking they are "catching the bus."
🙃 Emotion: Late greed and exaggerated confidence. It’s the classic "top."
🔴 Wave A-B-C — The Pain of Reality
• Wave A (denial): The price starts to fall. Many still think it’s just a correction and that it will soon go back up.
😕 Emotion: Denial.
• Wave B (deceptive hope): The price recovers a bit, reinforcing the illusion that "it has gone back up."
😌 Emotion: Illusory hope.
• Wave C (panic): The price plummets forcefully. Now fear dominates and many sell at the bottom.
😱 Emotion: Panic and despair.
That’s why Elliott works: it translates into waves the eternal repetition of human emotions in the markets.
🔄 When the Elliott count breaks
The market does not always respect the perfect drawing of 5 impulse waves + 3 corrective waves.
Sometimes:
The price exceeds levels it shouldn’t (example: wave 2 going down beyond the start of wave 1).
Wave 3, which should be the longest, does not confirm.
Or wave 4 invades the region of wave 1 (which breaks the basic rule of the theory).
📌 When this happens, it means that the Elliott structure has been invalidated.
And what should the trader do?
👉 Restart the count.
It's as if the chart says: "Forget this drawing, I'm starting another cycle."
🧠 What does this teach?
The market does not make mistakes — we do when reading it.
The restart of the count is not a failure, but rather a natural part of the analysis.
Learning to identify invalidations prevents you from getting stuck in a wrong expectation just because you wanted the signal to "work out."
💡 Practical summary:
When Elliott breaks → don’t force the pattern. Reset the count, wait for new waves to confirm, and only then go back to applying Fibonacci and planning entries.