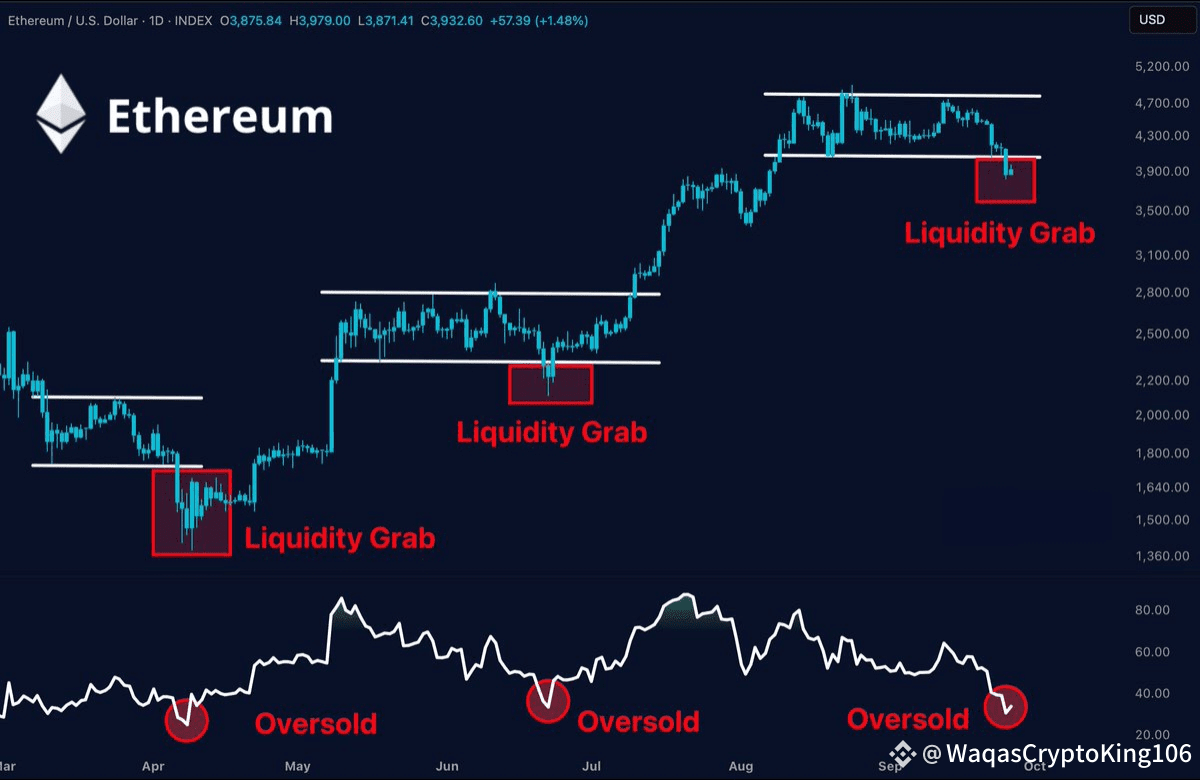
Ethereum ($ETH ) is showing a strong technical setup that traders should keep an eye on. The chart highlights repeated liquidity grabs and oversold RSI levels, both of which historically signaled reversals.
---
📊 Current Market Snapshot
Price: $3,939 (+1.48%)
Market Structure: Range breakout retest with liquidity grab
Momentum Indicator: RSI oversold zone
---
🔎 Liquidity Grabs in Action
Ethereum has now printed three major liquidity grabs this year. Each time, price dipped below support to trigger stop losses and trap sellers — only to reverse higher shortly after.
April: Liquidity grab under $1,600 → rally to $2,400+
July: Liquidity grab under $2,800 → rally to $4,000+
September/October: Current liquidity grab under $3,900 → setup for next potential rebound
👉 These patterns often precede a bullish continuation as institutions use the liquidity to enter positions.
---
📉 RSI Oversold Confirmation
The Relative Strength Index (RSI) is flashing oversold for the third time this year:
April oversold → strong bounce followed
July oversold → another rally
Now in September → RSI is oversold again
This adds confluence that ETH might be near a local bottom.
---
📌 Key Levels to Watch$ETH
Support Zone: $3,850 – $3,900 (must hold to avoid deeper correction)
Resistance Zone: $4,300 → $4,700
Upside Target if Bounce Confirmed: $5,000+
---
🧠 Market Outlook
Ethereum looks technically primed for a rebound if the liquidity grab holds. Oversold momentum plus repeated stop-hunt patterns suggest accumulation rather than breakdown.
But if $3,850 fails, ETH could revisit $3,500 before resuming its bullish trend.
---
📢 Traders’ Takeaway:
This could be another buy-the-dip opportunity for Ethereum, as long as the liquidity grab holds. Short-term volatility may continue, but the macro structure remains bullish.