
The price has dropped to the lower edge of the 70% trading volume range for the past 2 weeks, with RSI 15 hitting a one-year low. Spot small orders are continuously accumulating, and there are signs of 'not being able to drop further' in the short term. However, contract funds are still net outflowing. If the rebound cannot stay above 2.85, the bears will continue to dominate.
Key interval structure and trading volume distribution
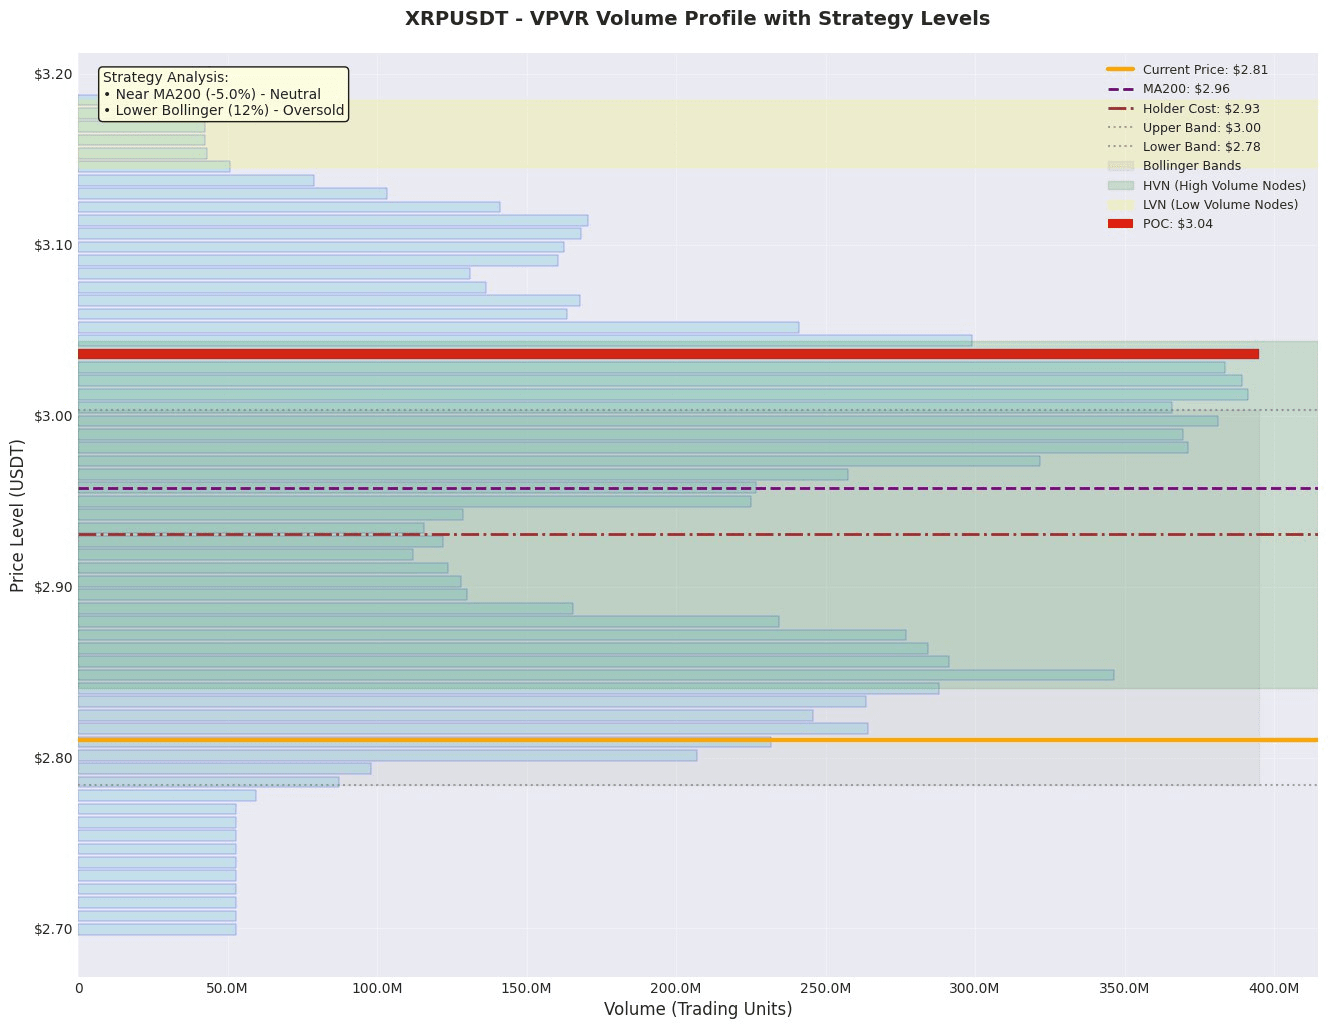
• Value anchor: POC = 3.036 (range 3.032-3.040), the most densely traded range in the past 2 weeks, with the current price deviating by -7.4%, indicating a significant discount.
• HVN buffer: 2.848 (2.844-2.852) and 2.973 (2.970-2.977) are two high pressures above, making it easy to encounter selling pressure upon a rebound.
• LVN gap: 2.777 (2.774-2.782) is a low volume area below, if broken, it may quickly slide to 2.70; if recovered with volume, it is viewed as a short trap.
• 70% transaction coverage: VAL = 2.801, VAH = 3.114, current price is at the 12% percentile of the range, close to the 'oversold edge'.
Momentum verification and leading direction
In the past 2 weeks, the Up/Down ratio around POC is about 48:52, slightly bearish; however, the Down Volume around 2.80-2.81 has suddenly shrunk after continuous expansion, combined with the extreme value of RSI 15, short-term short momentum shows signs of exhaustion, need to rise above 2.85 to confirm long dominance.
Auxiliary judgment
1h Bollinger Bands lower band 2.784 has turned upwards, price first closed inside the upper band; MA200 = 2.958 is still declining, divergence -5% provides mean reversion space. Contract OI increased then decreased within 24h, long-short ratio from 1.99 to 2.45, short positions are more aggressive, diverging from the price, cautious on rebounds.
Order book anomaly
Buy wall 2.80 total volume 1.12 million USDT, 2.6 times that of sell wall 2.81; however, sell orders are dense at 3.00-3.10 (>9 million USDT), short-term breakthrough requires volume to increase by more than 3 times to digest.
Market cycle determination
Since the drop from 3.35, the structure has shown 'downward - sideways - then downward', without higher highs, defined as a daily level descending channel; if 2.80 is lost, the channel will shift down, if held, it enters the 2.80-3.03 oscillation and accumulation phase, spot can be lightly grid traded.
Trading strategy (VPVR structure priority)
Aggressive: Backtest LVN 2.777 shows a 15m volume bullish line to go long, entry ≈ 2.782, stop loss 2.767 (-0.5×ATR), target 2.848 (recent HVN), RR ≈ 2.4.
Steady: After the closing price returns to 2.85 after 1h, chase long, entry ≈ 2.855, stop loss 2.834 (outside the lower HVN), target POC 3.036, RR ≈ 3.1.
Conservative: If it drops below 2.77 again and with volume, reverse and short, entry ≈ 2.768, stop loss 2.787, target 2.70, RR ≈ 2.0.
(ATR = 0.027, missing higher cycle volatility, stop loss width has been conservatively set at 1.5×ATR, medium confidence)
LP market-making suggestion
Expected 24h volatility 2.77-2.90, can place a dual-track 0.3% price difference grid in the 2.80-2.85 range, single-track position ≤ 30%, beware of sell walls above 3.00 or rapid pullbacks, set hard stop loss 2.75 and 3.05 for protection.
Risk and failure conditions
Long failure: 1h closing price falls below VAL 2.801 and LVN 2.777 has no resistance;
Short failure: volume breaks through 2.90 and stabilizes at 2.93;
External: US SEC sudden lawsuit progress, macro liquidity events can cause gaps, strictly control positions.
Like and follow for real-time updates!
$XRP