Experts look at K-lines as if they are interrogating a suspect — every bullish and bearish line, every segment of upper and lower shadows, is a suspect's confession. They don't get tangled in what the confession says, but focus on which statement is lying and which one hides the truth.
In the same K-line chart, ordinary people see red and green fluctuations, while experts can read the breathing of capital, the pulse of emotions, and even predict which pit retail investors will jump into next.
True experts look at K-lines like a seasoned traditional Chinese medicine practitioner examines the tongue coating — not fixating on the patterns themselves, but seeing through the patterns to understand the essence of qi and blood; not getting caught up in what this line is called, but pondering how money flows behind this line and how people think.
What they read from K-lines is never whether it will rise or fall tomorrow, but three essential layers of information: the true intention of the funds, the critical point of sentiment, and how they should respond.
One. Don't look at the attractive patterns, but whether the funds are genuinely active.
Beginners note: Red three soldiers indicate bullish, while cloud cover indicates bearish. Experts, however, are thinking: is this pattern made of real gold and silver, or is the main force drawing it to deceive me?
For example, two identical large bullish candles:
Beginners: Wow, a large bullish candle! It's going to rise.
Experts will first look at volume and position:
If this large bullish candle appears at a low position, with trading volume 1.5 times the usual, and in the bullish candle body, every penny has continuous transactions (for example, rising from 10 yuan to 12 yuan, with no long period of consolidation, and with a large amount of buy orders every time it rises by 0.1 yuan) — this indicates that real funds are entering the market, showing that the main force is actively accumulating and willing to spend costs to push the price higher.
If this large bullish candle appears at a high position, with trading volume fluctuating greatly (for example, opening with a sudden surge of 100 million, then shrinking to 20 million midway, and smashing out 50 million at the end), and there are large blank segments in the bullish candle (for example, jumping from 20 yuan to 21 yuan, with almost no transactions between 10 yuan and 11 yuan) — this is the main force performing a self-directed play, using a small amount of capital to create a pattern at the end of the trading day, with the aim of deceiving retail investors into taking over.
For example, the doji:
Beginners: Doji, balance between bulls and bears, a change is coming!
Experts will look at the upper and lower shadows of the doji:
A low position doji with a long lower shadow (for example, dropping from 10 yuan to 9.5 yuan, then pulling back to 10 yuan), and the trading volume of the lower shadow is 3 times that of the upper shadow — indicating that capital is frantically taking positions at a low level, and the sold chips have all been collected. This is false balance and true accumulation.
A high position doji with a long upper shadow (rising from 20 yuan to 21 yuan, then dropping back to 20 yuan), and the trading volume of the upper shadow is 5 times that of the lower shadow — indicating that there is capital frantically dumping at a high position, and the price pulled up cannot be maintained. This is false balance and true unloading.
Core logic: The shape of K-lines can be faked, but the strength and sustainability of funds cannot be faked. Experts look at K-lines, first filtering out lines drawn without volume and without sustained transactions, focusing only on lines made of real gold and silver.
Two. Don't look at single signals, but at the continuous changes in sentiment and critical points.
The essence of K-lines is the electrocardiogram of market sentiment. A single K-line represents a momentary sentiment, while continuous K-lines represent the trend of sentiment. Experts never shout bullish because of a single large bullish candle, nor bearish because of a single large bearish candle — they are waiting for the point where sentiment changes from quantitative to qualitative.
For example, the rebound in a downtrend:
Beginners see a large bullish candle and think it has reversed, while experts are tracking whether the sentiment has really strengthened:
The first bullish candle: it may just be a rebound from overselling, and emotionally, it's a few funds bottom fishing while most are watching.
The second bullish line: If it can engulf the previous day's pullback (for example, the first day rises 3%, the second day falls 1%, and the third day rises 4%, exceeding the first day's high), and the trading volume is even larger than the first day — indicating that the observing funds are starting to follow the trend, and the sentiment is shifting from hesitation to testing.
The third bullish candle: if there is a gap up (the opening price is directly above the previous day's closing price, not giving those who missed the opportunity a low price), and there is almost no pullback during the day — indicating that sentiment is completely ignited, changing from testing to panic buying, this is the critical point of trend reversal.
For example, the pullback in an upward trend:
Beginners are afraid of seeing a big bearish candle, thinking it has peaked, while experts observe whether the sentiment has really weakened:
The first bearish candle: it may just be the short-term profit-taking of a few people, while most are still waiting to add positions.
The second bearish candle: if it breaks through the recent 3-day support level (for example, if it has been above the 5-day moving average for the past 3 days, but today it breaks below the 5-day line), but the trading volume is smaller than the first bearish candle — indicating that the selling pressure is weakening, and sentiment is only slightly panicking, not yet at collapse.
The third bearish candle: if it opens low and declines, with a significant volume drop below the 20-day moving average, and all intraday rebounds are smashed down — indicating that panic sentiment begins to spread, changing from a few people cashing out to a majority fleeing for their lives. This is the critical point of trend breakdown.
Core logic: The change in market sentiment is gradual, from hesitation to testing to frenzy, or from optimism to doubt to panic, with countless signals in between. Experts look at K-lines to find the turning point where sentiment jumps from one stage to the next — this point is the real trading signal.
Three. Don't look at the K-line itself, but at the flaws of the main force and the consensus of retail investors.
The stock market is a battleground between the main force and retail investors. The main force's K-line operations are essentially to use formations to deceive retail investors into making wrong decisions; while the consensus among retail investors (for example, everyone thinks they should buy once a certain price is broken) is often exploited by the main force. Experts look at K-lines to find the flaws in the main force's deception and the moment the retail consensus is broken.
For example, the flaws in the main force's wash:
When the main force is washing the盘, it will deliberately smash out a large bearish candle to create the illusion of a big drop, but experts can see the traces of 'pretending to smash' from the K-lines:
On the day of a large bearish candle, the trading volume is very small during the drop (for example, dropping from 10 yuan to 9.5 yuan, and this part of the trading volume is only 50% of the usual) — indicating that there are not many real sell orders, and the main force is playing with itself.
When hitting a key position (for example, the previous cost absorption area of 9.5 yuan), a sudden surge of buy orders appears, quickly pulling the price back — indicating that the main force is protecting the market and does not want to truly break below its cost.
After the wash is over, a bullish candle directly engulfs all the bearish candles from the wash, and the trading volume increases — indicating that the main force has finished washing and is starting to work.
For example, the moment when the consensus among retail investors is broken:
Retail investors often have anchoring psychology. For example, if a stock has been fluctuating between 10-12 yuan for a long time, retail investors will think that 10 yuan is the bottom and 12 yuan is the top. The main force will deliberately break this consensus:
First, repeatedly fluctuate around 12 yuan, allowing retail investors to form a consensus that they should sell at 12 yuan.
Suddenly one day, a volume breakout occurs at 12 yuan, and the closing price stabilizes at 12.5 yuan — at this moment, retail investors will hesitate: should I chase?
In the following days, there will be slight retracement around 12.5 yuan, but it will never drop back below 12 yuan — thoroughly breaking the retail consensus that 12 yuan is the top, making them fear missing out and chase the rise, giving the main force the opportunity to push up.
Core logic: K-lines are records of the psychological struggle between the main force and retail investors. Experts look at K-lines not to see what the lines look like but to think about how the person who drew this line wants the viewers to think — understanding this layer means not being led by patterns.
Fourth, the ultimate view of K-lines for experts: knowing what to do and more importantly, knowing what not to do.
Beginners looking at K-lines always want to find guaranteed signals; experts looking at K-lines, however, are establishing probability thinking — what they read from K-lines is not only opportunities but also risk boundaries.
For example, an expert sees a long upper shadow at a high position and does not say it will definitely fall, but thinks: the probability of the main force unloading here is 70%, and the probability of continuing to rise is 30%. If I am holding positions, I should set a stop-loss (for example, if it falls below the previous day's low, I will exit); if I am out of the market, I absolutely cannot touch it, because the risk far exceeds the reward.
For example, seeing a low-volume doji, the expert will not say it will definitely rise, but think: this may be the bottom, but it hasn't been confirmed. I can try with a small position (for example, buying 10% of the position); if the subsequent volume bullish candle confirms, I will increase the position; if it breaks below the doji low, I will stop-loss.
Core logic: K-lines cannot predict the future, but they can tell you what is happening in the current market and what strategies you should use to respond. Experts look at K-lines ultimately to find the balance point of risk and reward, rather than pursuing precise predictions.
In stock trading, understanding K-line patterns is crucial for short-term trading because K-lines are intuitive, clearly showing the direction of price fluctuations, and are more timely than indicators. Below are some short-term pattern tactics that I recommend saving and sharing!
The bullish combination of two K-lines: bottom pregnant line (bullish pregnant line, star pregnant line), bottom front bearish and back bullish hollow line, front bearish and back bullish hugging line, flattery line, friend counterattack (bullish covering line), dawn emerging, rising sun, climbing line, jumping line, flat bottom pattern, end of decline line.
After years of trading summaries, I have studied all the trend patterns and established 9 iron rules. Once I see them, no matter right or wrong, I will run as far as possible. No matter how tempting the market is, I will decisively exit.
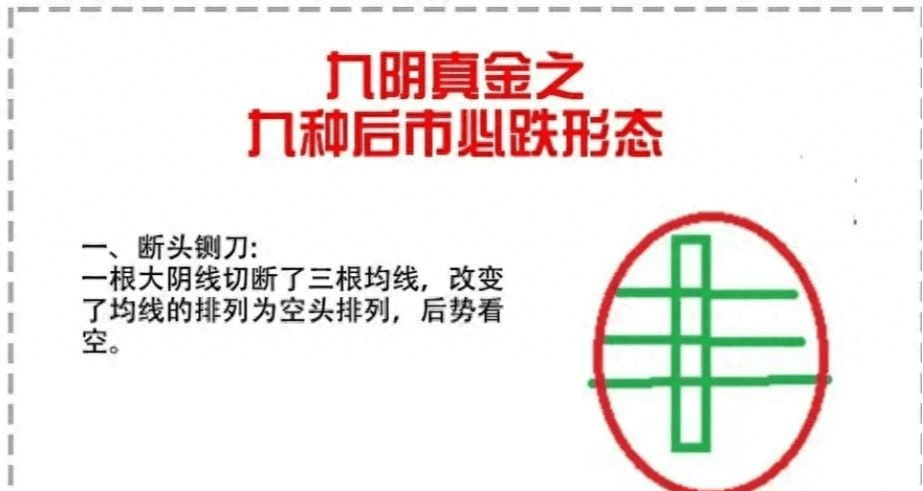
One. Guillotine.
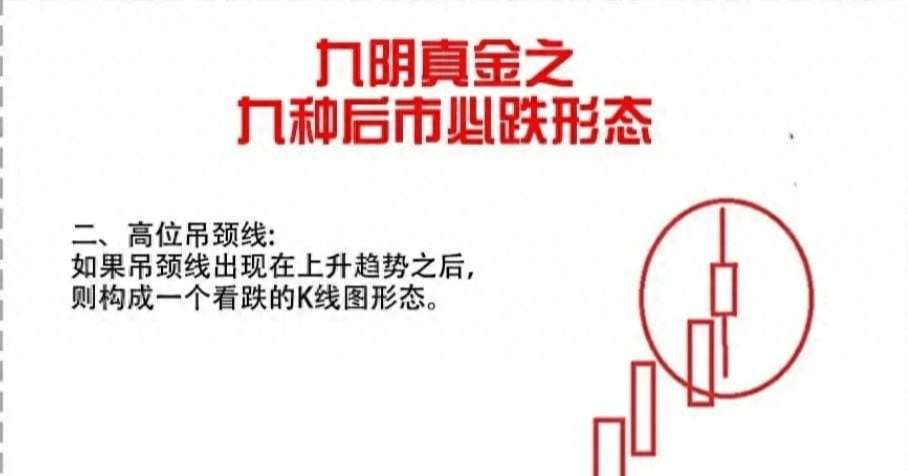
Second, high position hanging man.
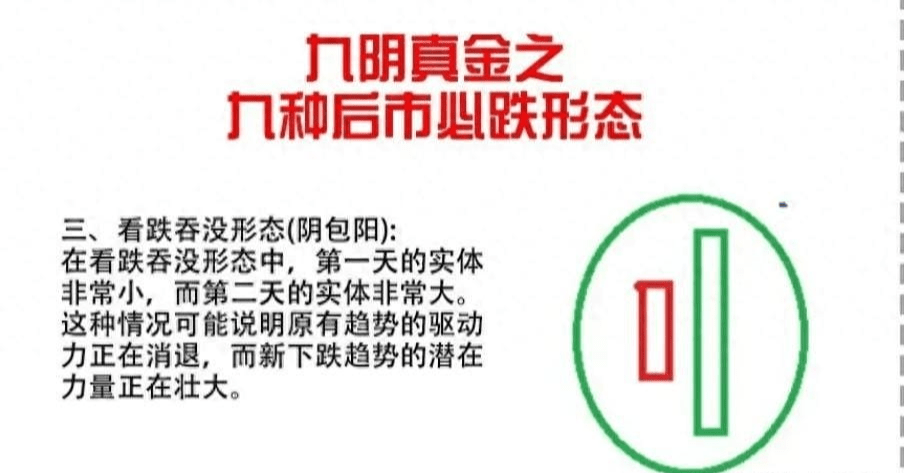
Three. Bearish engulfing pattern (bearish wraps bullish).
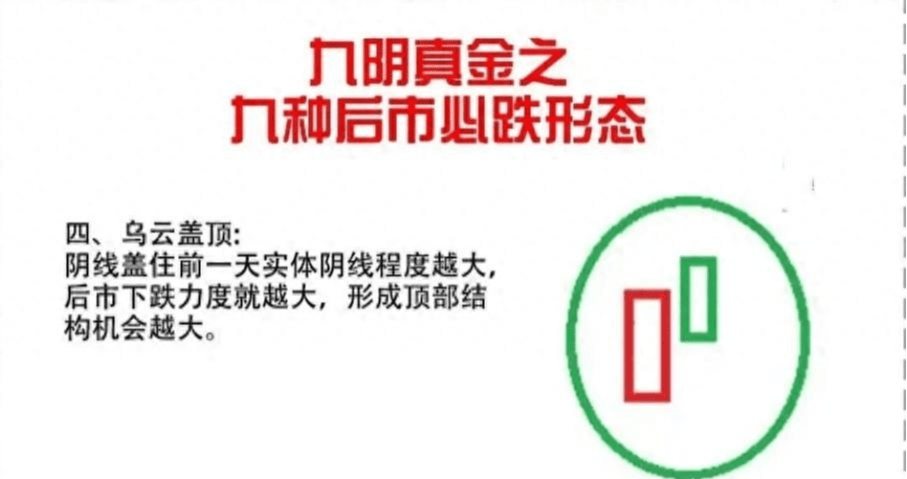
Fourth, cloud cover on top.
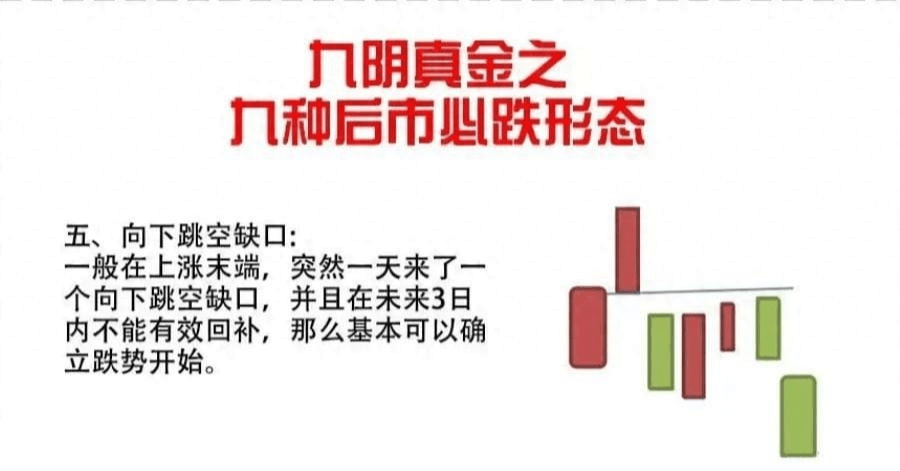
Five. Downward gap.
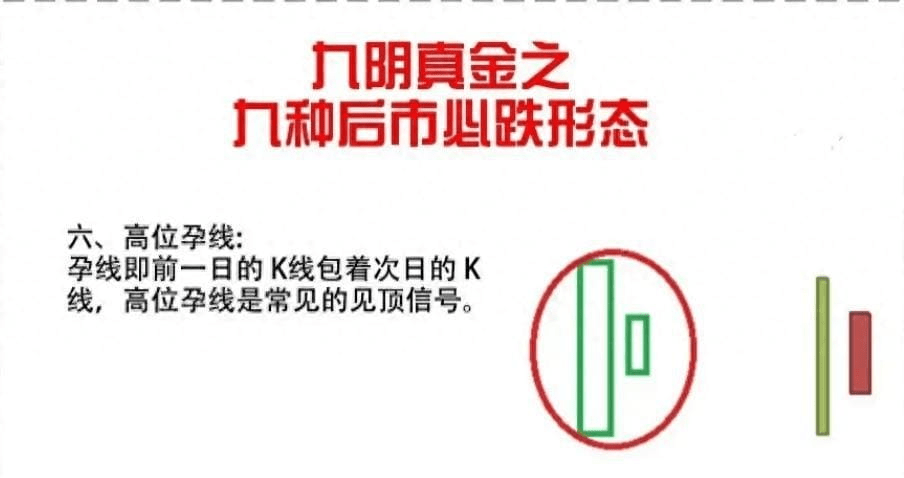
6. High position pregnant line.
7. Evening star.
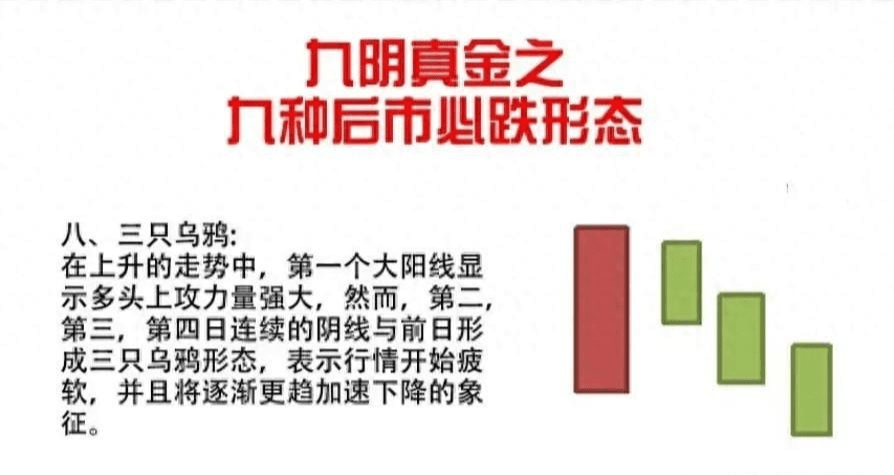
Eight. Three black crows.
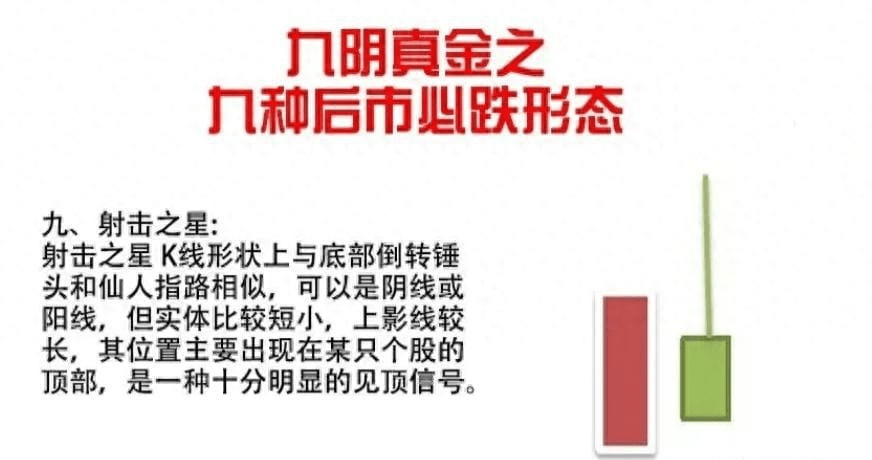
Nine, shooting star.
Nine special K-line patterns.
K-line patterns are an important basis for judging stock price trends, so we must remember these 9 K-line patterns, and with the corresponding graphics, even beginners can easily understand.
Today's patterns include: old duck head, cheetah strikes, upward gap parallel bullish lines, ascending channel climbing shape, five lines going up, fish leaping over the dragon gate, breakthrough gap, golden valley, and a bullish candle crossing three lines. Let's discuss each pattern one by one.
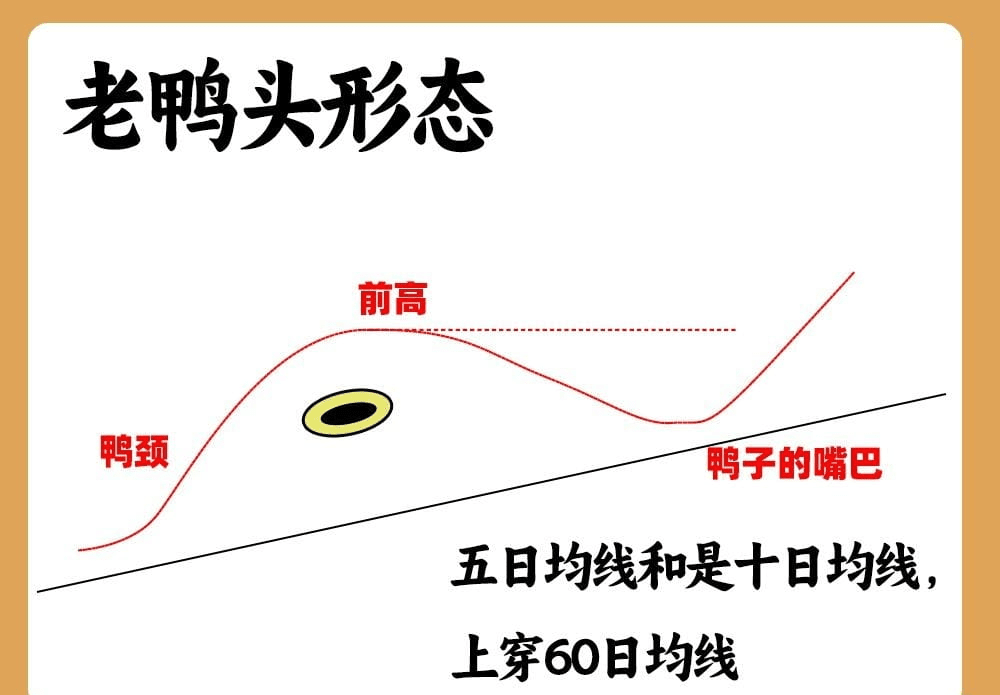
One. Old duck head pattern.
The commonly used 5-day moving average and 10-day moving average cross above the 60-day moving average. The stock price continues to rise along the 5-day moving average, forming a duck neck. When the stock price shows signs of weakness and begins to pull back, it forms the head of the duck. When the stock price stabilizes, and the 5-day and 10-day moving averages form a golden cross, it resembles a duck's mouth. Such a pattern is called the old duck pattern.
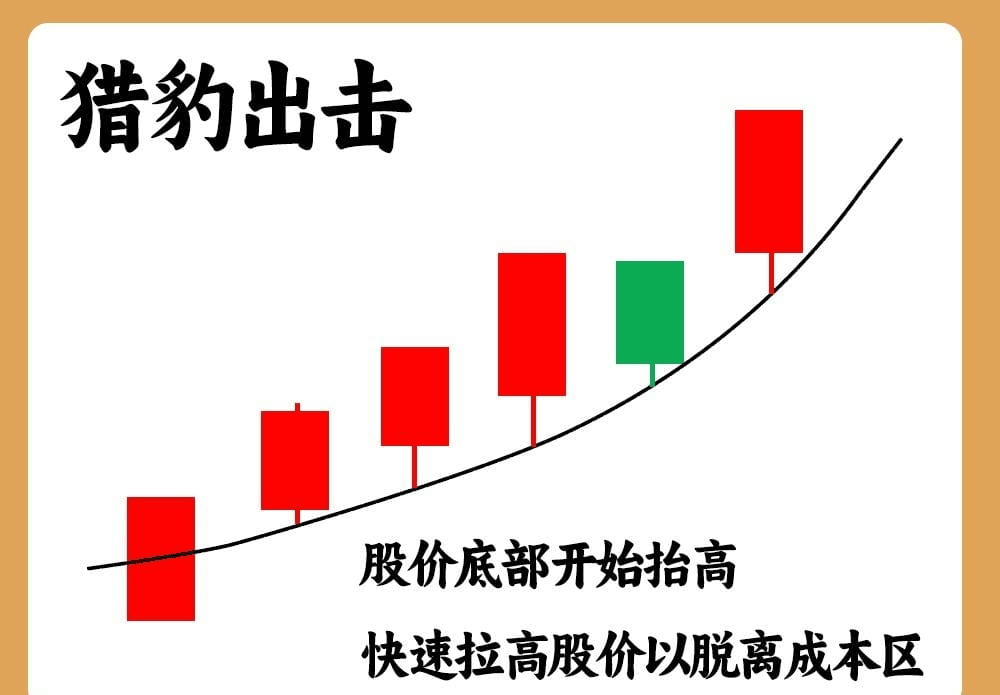
Two. Cheetah strikes.
After the stock price has been in a long-term consolidation, the bottom of the stock price begins to rise, suddenly breaking through the 60-day moving average, quickly raising the stock price to leave the cost area. When breaking through this moving average, it often releases a large amount of volume.
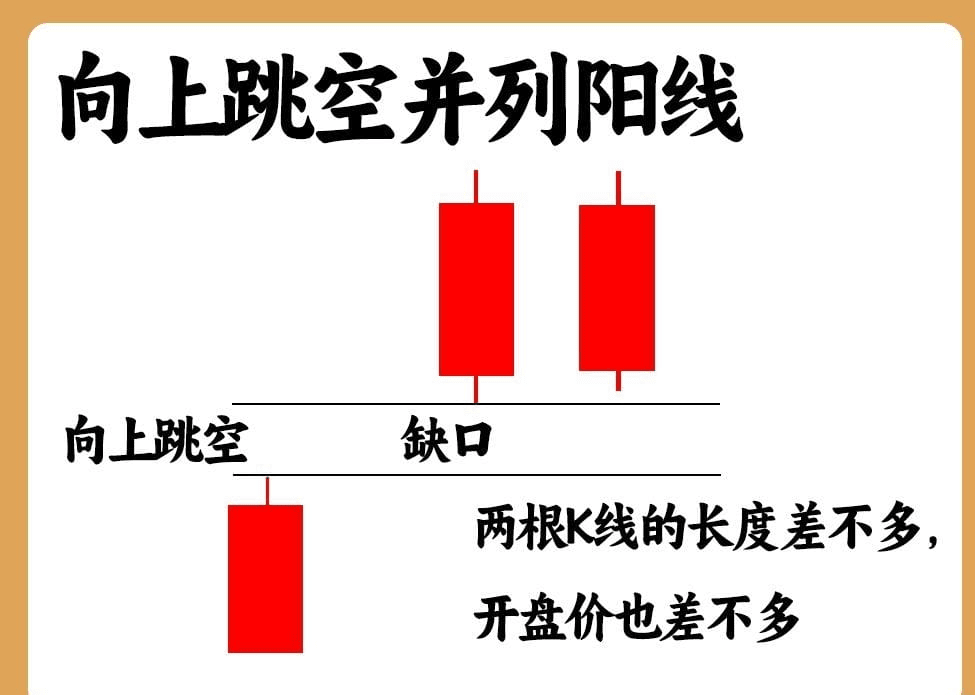
Three. Upward gap parallel bullish lines.
In an upward trend, a bullish candle appears with a gap up, followed by another bullish candle, but these two K-lines are roughly the same length, and the opening prices are also about the same, which is called a parallel bullish line! This indicates that the main force wants to quickly leave its cost range, and this gap also has strong support.
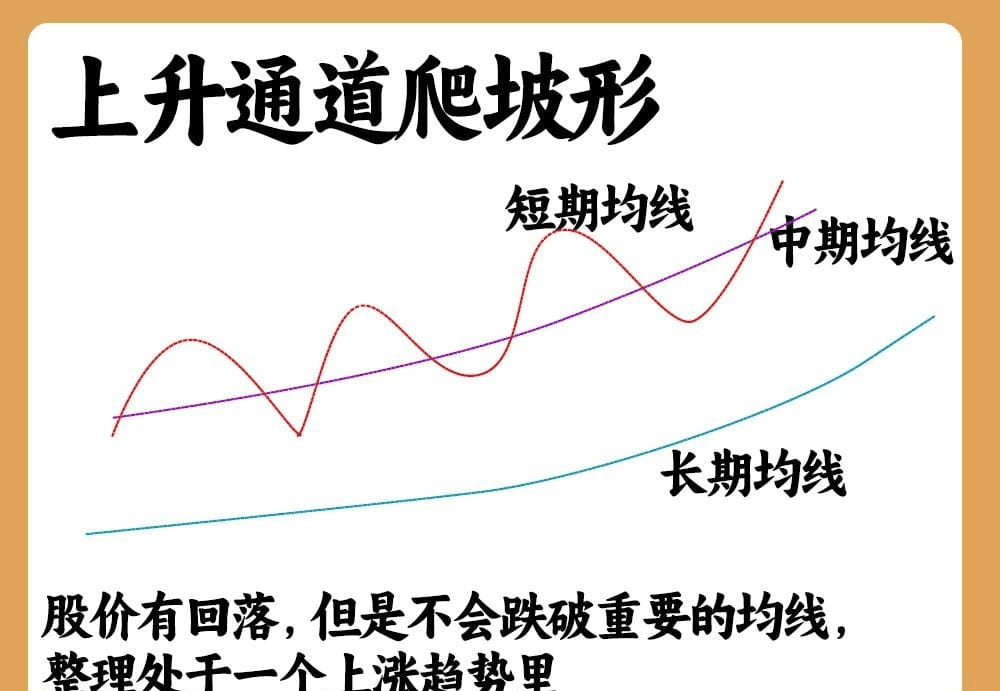
4. Ascending channel climbing shape.
The short, medium, and long-term three moving averages are in bullish divergence, and the stock price rises along the moving averages. Although the stock price may pull back, it will not break through important moving averages, and the consolidation is in an upward trend. Such a market is in a stable upward trend.
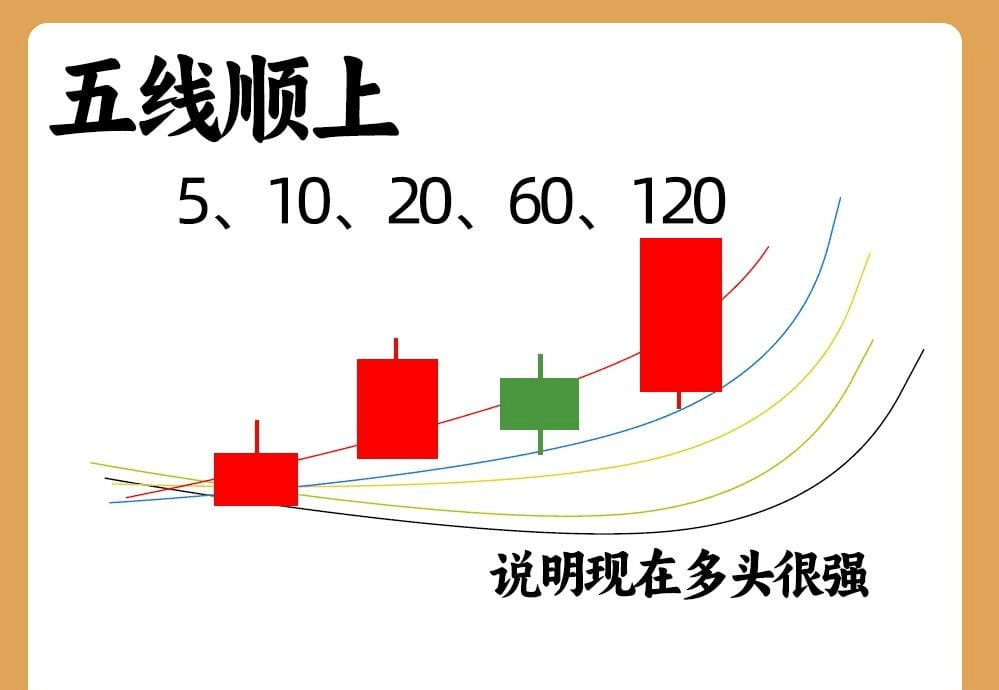
Five. Five lines going up.
The 5-day, 10-day, 20-day, 60-day, and 120-day moving averages are also the half-year line. These five moving averages are all in a bullish trend. The moving averages start from the top 5-day moving average, and as they go down, the moving average periods get longer. This indicates that the bulls are currently very strong. The 120-day moving average represents the half-year holding cost.
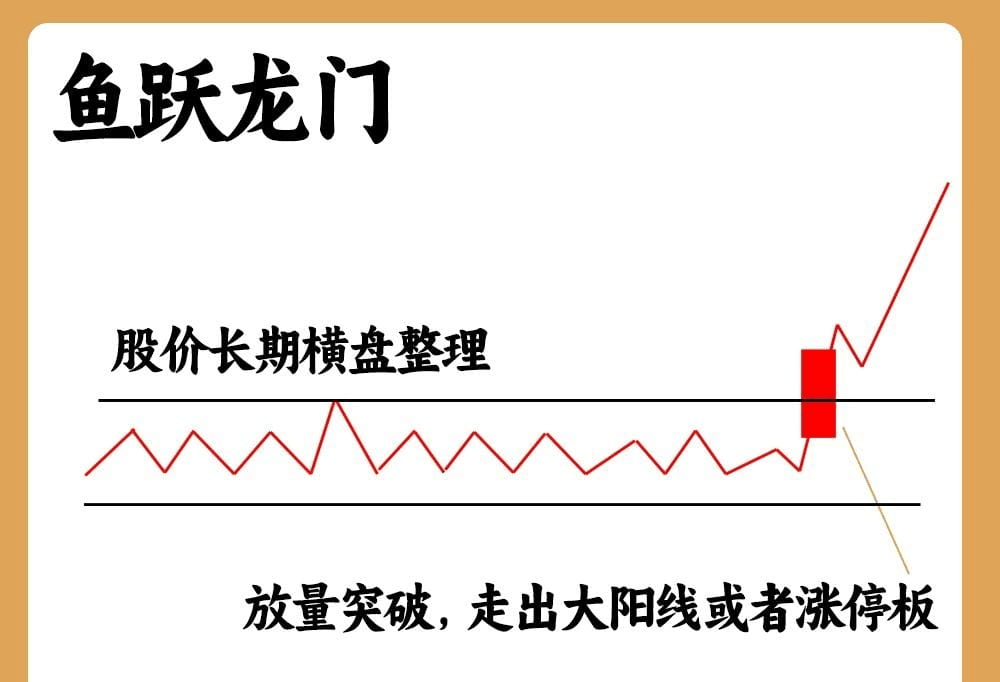
6. Fish leaping over the dragon gate.
The stock price has been consolidating for a long time, and the volume begins to gradually increase, with small bearish and bullish candles slowly moving upwards. When the stock price opens high with a large bullish candle, breaking through the previous resistance level, this pattern is called 'the fish leaping over the dragon gate.' The key here is the volume breakout, leading to a large bullish candle or a limit-up.
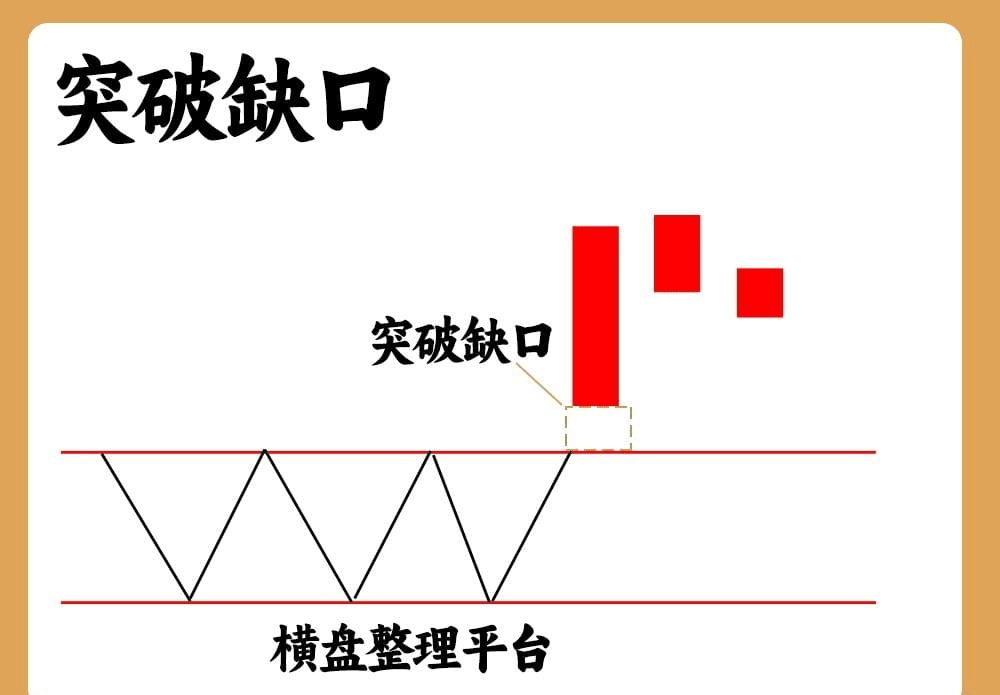
7. Breakthrough gap.
When the stock price is low, and an upward gap appears, it changes the original trend. The gap also has a certain support and pressure effect, opening up space above; the upper edge of the gap forms a support level.
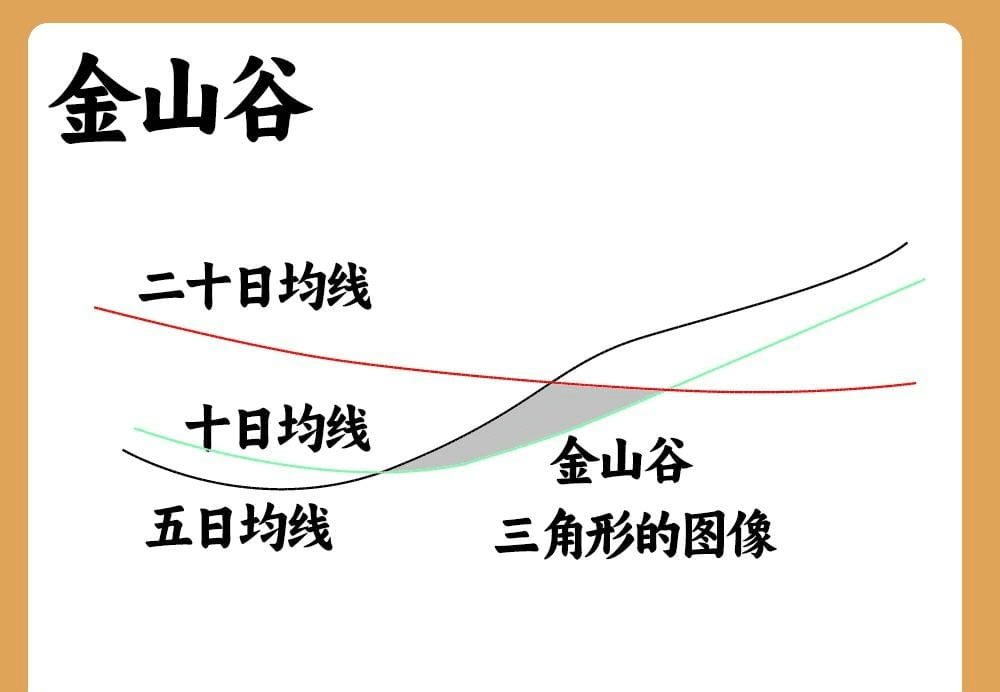
Eight. Golden Valley.
The 5-day moving average first forms a golden cross with the 10-day moving average, then forms one with the 20-day moving average, and the three moving averages form a triangular shape. The first appearance of this triangular shape is the Silver Valley. When it appears again, this golden cross forms a triangular shape, it is called the Golden Valley. This pattern is formed after an increase, followed by a pullback adjustment, and then a continued rise.
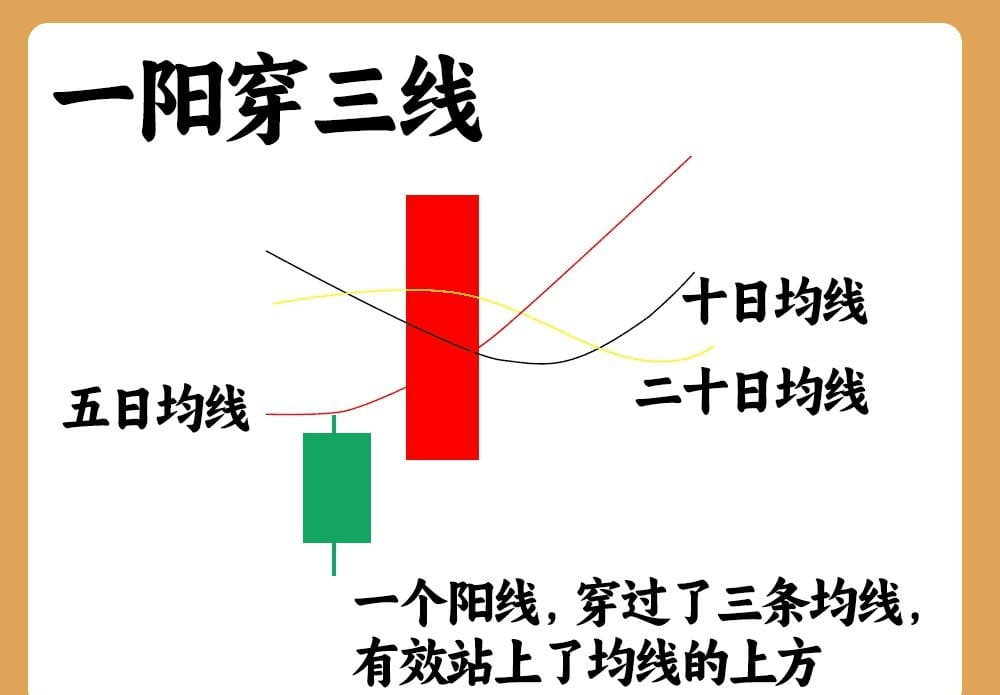
Nine. A bullish candle crossing three lines.
This is something everyone is familiar with; the commonly used 10-day, 20-day, and 60-day moving averages start to intertwine after the stock price has been in a long-term consolidation. Suddenly, a bullish candle appears, breaking through the three moving averages, effectively standing above them — this is a bullish candle crossing three lines, and often by this time, the main force has finished accumulating.
Alright, the above are the nine common K-line patterns in an upward trend, each of which is relatively common and worth remembering. In the future, I will continue to share other K-line patterns in different trends.
If you want to achieve financial freedom through stock trading, you must remember these eight iron rules!
1. Everyone has greed, anger, and ignorance; when the market rises, they always want to earn more, and when the market falls, they start to play dead, unwilling to admit defeat. After finally breaking even, they quickly become 'cattle herders.' In this market, if you have no principles, you will definitely be influenced by the market makers and your own emotions. My principle is that each loss should not exceed 5% of the principal; if I profit, it should be at least 10%. Once I have more than 10% profit, I start to give back, ensuring that I cannot lose in that transaction.
2. Concentrated investment, learn to hold cash. The biggest pain point for retail investors is: not knowing how to hold cash, weak positions averaging down, having too much stock with little capital, stubbornly holding on to losses. Those with less than 1 million should not exceed 3 stocks. Remove those stocks with large-level moving average systems trending down, weak stock characteristics, and not in the mainstream track. Admitting wrong decisions may require great courage, but acknowledging one's mistakes is the beginning of success. Those who can buy are disciples, those who can sell are masters, and those who can hold cash are the ancestors.
3. Volume and price are the only indicators that do not deceive. Returning to basics, mastering volume and price is enough to allow you to outperform 80% of traders. A volume breakout often indicates the involvement of funds, and the market generally experiences significant movements. A 0.5x volume indicates obvious contraction; a new high on low volume suggests high control by the main force, ruling out the possibility of unloading by the main force. In an upward trend, it is highly likely to gain.
4. Trend is king, go with the trend. Once a trend is formed, it will not easily change. The inexperienced die from bottom fishing, while the skilled die from top fishing. The wisest choice is not to guess, not to predict, not to hypothesize, but to follow the trend. If you cannot judge the trend, then look at the moving averages; the so-called moving averages are all parallel upward at a 45-degree angle, and it is difficult for such stocks to lose.
5. Buy on divergence, sell on consensus. It's just like the previous industrial mother machine sector; once the industrial mother machine rises, there will definitely be differentiation because the main force wants to profit when everyone is willing to take over, cashing out at high positions. Therefore, it is said to sell on consensus. Buying on divergence, doing strong stocks follows a principle: the strong remain strong. If a stock can become a strong stock or a monster stock, it must be a favored stock in the market.
6. When trading is not going smoothly, one must remain calm. The difficult path is not one everyone has the right to walk; only those who can endure the pain of rebirth are worthy of the beauty of rebirth. Many people suffer significant losses just like me, unwilling to admit defeat for 15 years, and in 16 years, they couldn't find their way after a circuit breaker loss. I am very grateful for this experience because I have stood up again, and I believe I will not fall again. In fact, the smoother the trading, the more one needs to keep a low profile.
7. "A general's success is built on the bones of thousands," stock trading is actually very bloody; the truth of this market is that one makes money, two break even, and seven lose. Many stock market experts I know study Buddhism. For every major market wave, whether rising or falling, we choose to release life. I know this is meaningless, but we seek smooth thoughts.
Finally, three key points retail investors must know to make money in stock trading.
One. Follow the market.
Experience shows that the market speaks for itself; the market is always right. Those who underestimate the market's capabilities will eventually suffer great losses.
The stock market is always right; the wrong one is always us. We cannot change the world; the only thing we can change is ourselves. We must watch the market with humility and caution to stand undefeated in the stock market.
In the stock market, no matter how people predict, it could be wrong; only the market can give the most accurate answer.
Two. Preserve principal.
The risks and rewards in the stock market are proportional, and the safety of the principal should be the top priority. Investment master Buffett said: Safety is the first priority in stock market investment; safety is still the second priority; the third priority is to remember the first two. The principal is like a seed; without seeds, one cannot plant and harvest.
In the investment market, preserving principal is more important than making money. It can be said that before considering making profits in stock investment, the first consideration should be how not to incur losses and preserve principal, then think about how to profit. If the principal is gone, making money is just empty talk.
In any war, to achieve victory relies on strength. Those with strong strength have greater chances of winning. If we compare the investment market to a battlefield, then capital is the investor's strength — the stronger the strength, the greater the possible gains.
Three. Set a stop-loss level.
Almost all successful stock traders strictly develop stop-loss plans before investing. Once they reach their pre-set loss point, they should immediately stop-loss, without any luck-based thoughts.
Stop-loss is an important means of protecting oneself in stock trading, just like the brake system in a car. When encountering sudden situations, one must 'hit the brakes' to ensure safety. The ultimate purpose of stop-loss is to preserve strength, improve capital utilization and efficiency, and avoid small mistakes leading to big ones or even total failure. Stop-loss can prevent suffering from greater investment risks.
Stop loss is both a concept and a plan, and also an operation.
Investors must recognize the critical importance of stop-loss in stock market investment from a strategic perspective, because in the high-risk stock market, survival is the first priority before further development. The key role of stop-loss is to allow investors to stay alive.
It can be said that stop-loss is one of the most critical concepts in stock market investment.
A stop-loss plan refers to the need to formulate how to stop losses before implementing an important investment decision. The most crucial step in the stop-loss plan is to decide the specific stop-loss level based on various factors (such as important technical points or capital conditions, etc.). The stop-loss operation is the implementation of the stop-loss plan; if the stop-loss plan cannot be converted into real stop-loss operations, stopping losses is just empty talk.
In the end, those who have been through the rain always want to hold an umbrella for others. The above is a summary of my 17 years of practical experience and skills in stock trading. Having experienced days of isolation and helplessness, I can empathize with others' losses. I want to extend a helping hand, to make up for the regret of wanting to be pulled up back then, as if crossing time to hold an umbrella for my past self who was caught in the rain. This is also my original intention for sharing, hoping to help many retail investors avoid some detours!
Focus on discussing and exchanging techniques with Old Chen, leading strategies, main force control strategies, strong stock operation methods, identifying trends, and knowing buying and selling points! You will definitely gain more!


