The trading model is usually divided into two categories: one is high-frequency operations with low profit margins; the other is low-frequency trading with high profit margins. Short-term trading belongs to the former, while medium to long-term trading leans towards the latter. Therefore, if you want to excel in short-term trading, the key lies in improving the win rate—each individual profit might be limited, but by steadily accumulating each return, you can achieve compound growth in the long run. The knowledge system of short-term trading is extremely complex; here I will only extract key points, and the rest you need to comprehend on your own:
Certainty is always the primary principle; only participate in trades you are proficient in and have a high win rate, avoiding ambiguous areas.
Short-term trading emphasizes taking small risks for large rewards, focusing on leveraging the trend—key studies on the overall market trend and sector linkage. Current operations are difficult, fundamentally due to a lack of leverage ability.
Do not participate in a volatile market! This specifically refers to a volatile market entangled with a 55-day moving average, not a one-sided declining market.
Stock selection logic: Macroeconomic environment > Sector strength > Stock quality. Relying solely on K-line patterns for stock selection is a futures mindset; stock investment needs to be based on industry logic and capital flow. The real skill lies outside the charts, not in them.
Technical analysis should be simplified to price-volume relationships, at most supplemented by a moving average system to avoid indicator redundancy.
Stay close to hot sectors! If you can't catch the leading stocks, invest in follow-up stocks, which is still better than cold sectors. For instance, the recent rotation in regional themes, once the leading stocks are locked, those in the same sector at low positions still have substantial returns.
The basis and changes in open positions of stock index futures, as well as the relationship between spot and futures, are key areas that must be conquered for short-term trading.
Techniques for short-term trading such as hitting the board, low absorption, midway trading, and arbitrage need to be mastered from multiple dimensions. A single technique has limited applicable scenarios, for example, a pure hitting strategy has a valid operational period of less than one-third of the year.
Although small funds cannot directly hedge stock indices, they can achieve risk hedging through graded funds or ETF options, ensuring that profits can still be made even in adverse conditions.
Always set profit targets when trading, and lock in profits by exiting in batches!
As long as you can adhere to the following 3 not participate and 1 participate, small funds can grow rapidly; it is not a problem! Stock trading has its speed! Whether you are an old investor or new, you must carefully read this article! Understanding it thoroughly can help you avoid five years of detours!
The advantage of micro-investors is that their funds are small, allowing for entry and exit at any time! To achieve short-term gains, one must leverage favorable conditions! Time is also a crucial factor for small investors; time costs must be considered!
The main force at the bottom has various techniques! Pressing down to absorb, maintaining absorption while falling, absorbing in sideways movement, the methods make it hard to guard against! The main force accumulates stocks; if you enter before they have enough stocks, you are just wasting time, being led by the main force. Remember, small funds also have time costs! When the main force washes the plate, the techniques resemble unloading, making it hard to distinguish between true and false! Entering early also brings anxiety; it’s better to be an observer!
3 not participate and 1 participate
1. Do not participate in the main force's bottom-driving inventory!
During the main force's accumulation period, there are still many uncertainties to face. The time needed for accumulation or success is all numerical. For stock investors, this uncertainty must be avoided!
2. Do not participate in the main force's consolidation!
Common states of consolidation include triangle consolidation states, model consolidation states, and others. This is after the main force has pulled up the market.
A relatively common trend in this price range is that the main force needs to digest profit margins and reduce positions or costs, redeploying funds, which takes considerable time. Retail investors should not participate as it can save time and avoid wasting a lot of opportunity costs.
3. Do not participate in the main force's washing process!
When stock prices start to decline, it is hard to discern whether the main force is washing the plate or unloading stocks. To prevent being stuck at a high position, retail investors should not participate in the washing process. After the stock price declines for a while, one can determine whether the washing is over based on trading volume and line patterns before deciding to intervene!
4. Only participate in breakout trends!
After the main force's accumulation ends, there will definitely be a rapid exit or breakout; the breakout line is a signal. The end of accumulation means the main force is also going to rapidly exit, so the breakout from the upper track of the consolidation pattern is also a signal. These breakout signals are the timing for retail investors to intervene. As you know, there are very few times when the actual timing is perfect; most of the time it will be in a state of fluctuation and decline. Retail investors must learn to take some actions and give up others, only engaging in launching upward trends to ensure small funds can grow rapidly!
To facilitate everyone's understanding and learning, I will present the information in a visually rich manner at the end, so everyone can see.
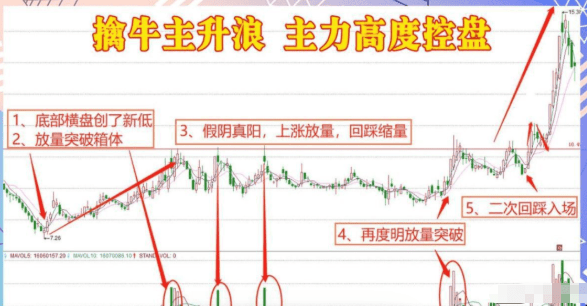
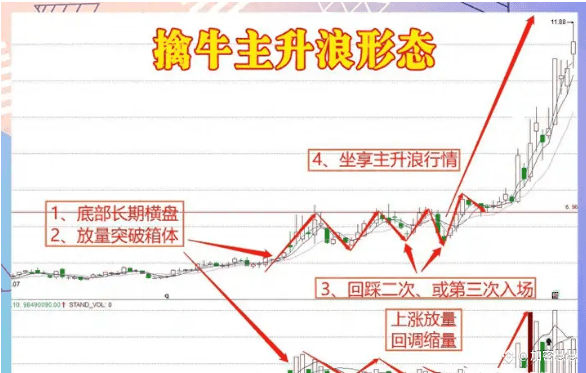
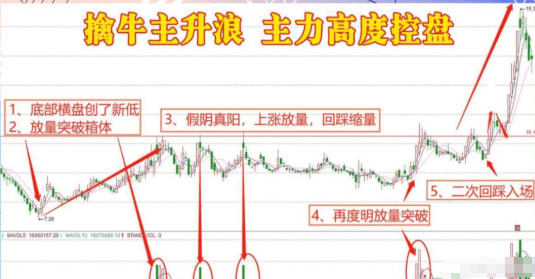
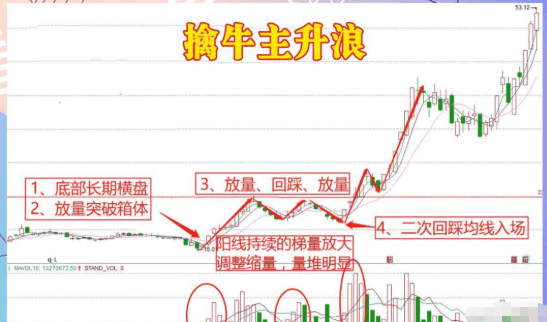
Three major characteristics before the main upward wave starts:
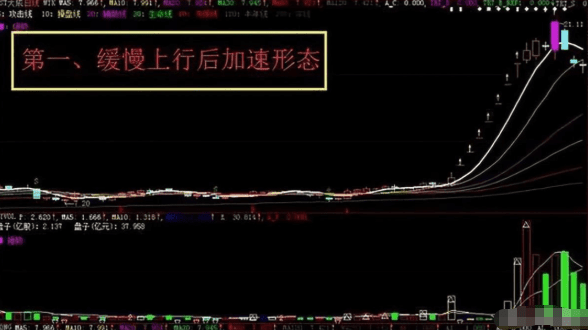
The first type of pattern can be metaphorically described as an airplane sliding down the runway. The stock price rises slowly for more than eight trading days, with the majority of the trading days closing with small positives, and the number of days closing with negatives does not exceed one quarter.
This is the main force slowly absorbing stock and pushing up the price to accumulate energy for the main upward wave:
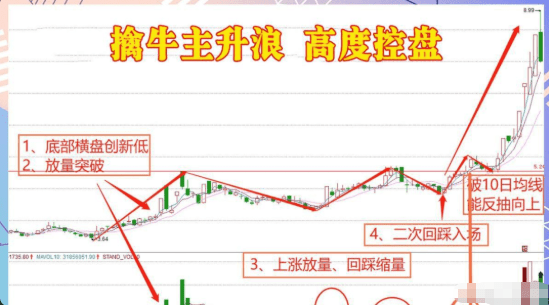
The second type of pattern can be metaphorically described as a running jump. Due to time constraints, the main force first slightly raises the price to absorb stocks, then briefly suppresses and washes the plate, and subsequently initiates the main upward wave:
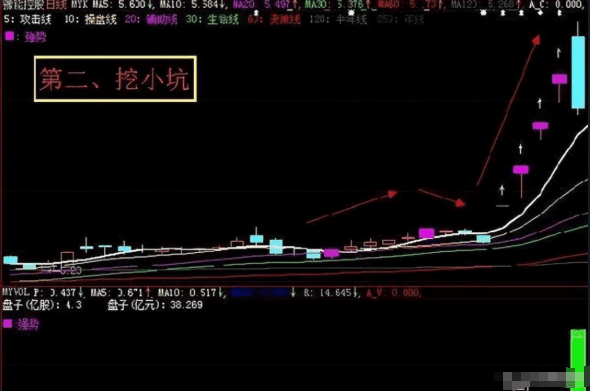
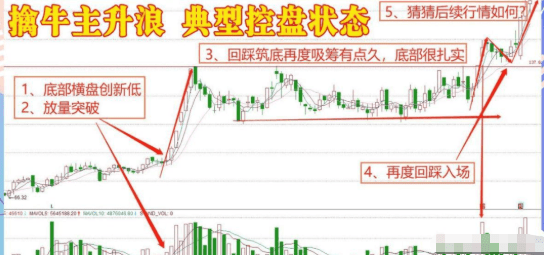
The third type of pattern can be metaphorically described as stepping on a single spring, as the main force continuously suppresses and absorbs stocks, leading to a quick decline, followed by a rapid rise, breaking away from the main force's cost zone, forming a main upward wave:
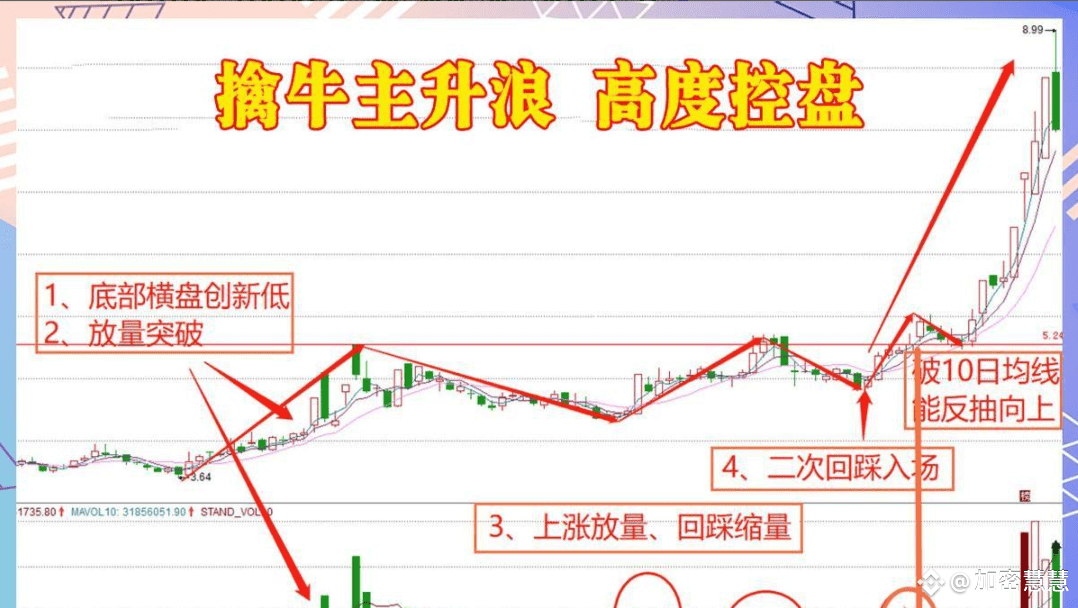
When the daily K-line shows small negative and positive lines in consolidation, until the appearance of a significant volume positive line, the main upward wave is initiated.
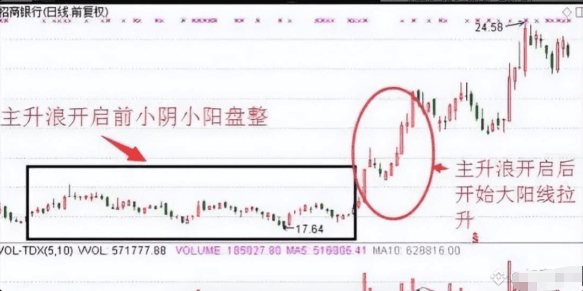
Generally, if the stock price is at a relatively low level, the main force will slowly push it up with small negative and positive lines, and the increase is deliberately controlled within 7%; because at this point, the main force does not want anyone to follow suit, and even less wants the increase to exceed 7% and get flagged. Once the stock price shows a certain increase and the main force hopes for market participation, a large positive line will appear to quickly break away from its cost area.
For example, the above chart shows the recent trend before the main upward wave starts. Before the start, the K-line shows small negative and positive arrangements, and the trend is in a state of consolidation, while after entering the main upward wave, the stock price enters a rapid rise phase, continuously producing large positive lines.
Moreover, it will not easily fall below the 20-day moving average. Even if it briefly falls below, it will be quickly pulled up by the main force.
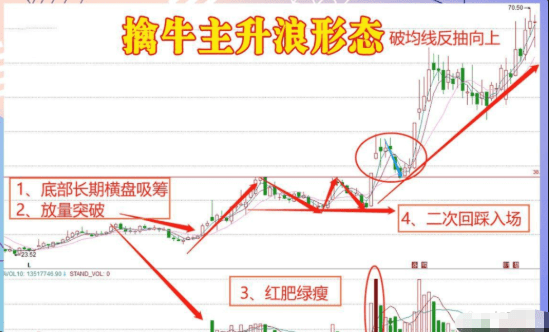
Finally, I would like to share five types of main upward wave patterns:
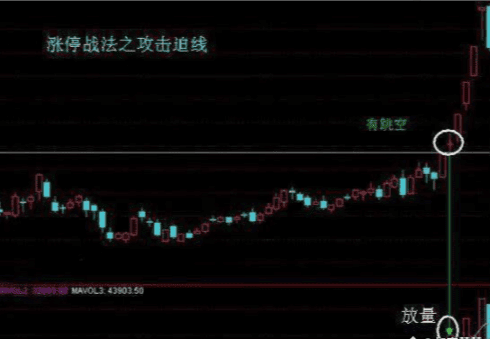
1. Attacking the pressure line for the main upward wave: During the stock price’s movement, the upward attack is met with a downward pull from the pressure line, but on a certain day, it opens high with a doji line, which can be either a negative or positive line, and the gap is not filled during trading.
2. N-shaped starting main upward wave: In an upward trend, after reaching a certain height, the stock price adjusts, and both the rise and the pullback must be in multiples of volume, forming an 'N-shaped' pattern for the stock.

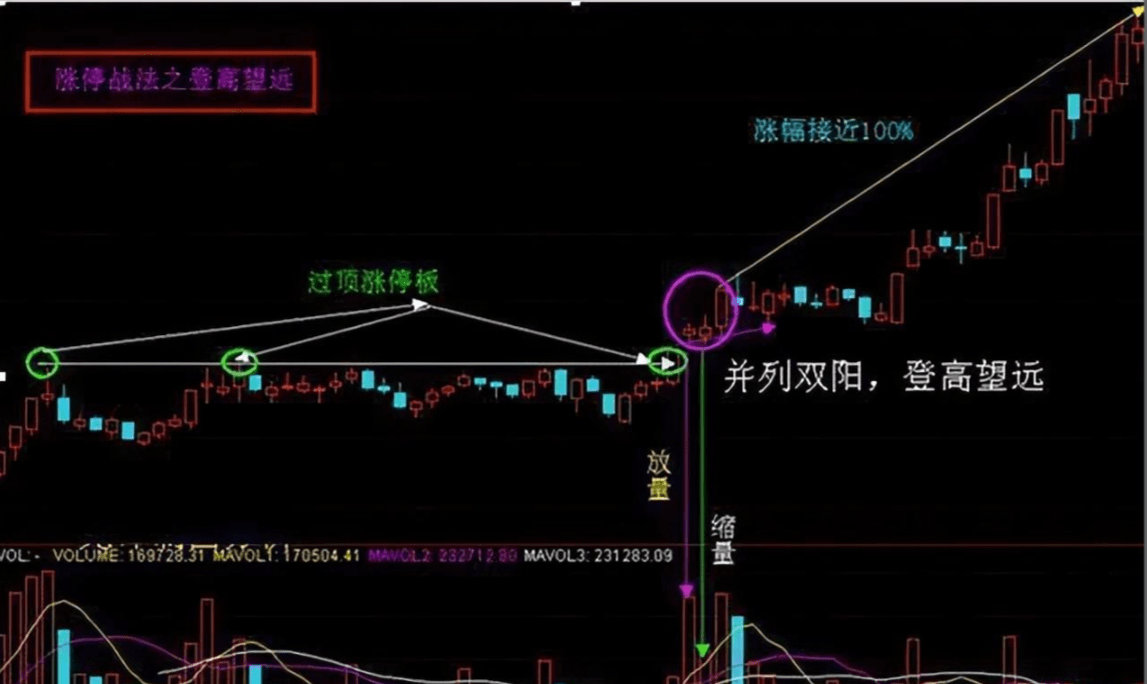
3. Looking far and wide main upward wave: The stock price has previously shown three consecutive upper limit stops. After the limit-up, in the next two trading days, two parallel positive lines are formed.
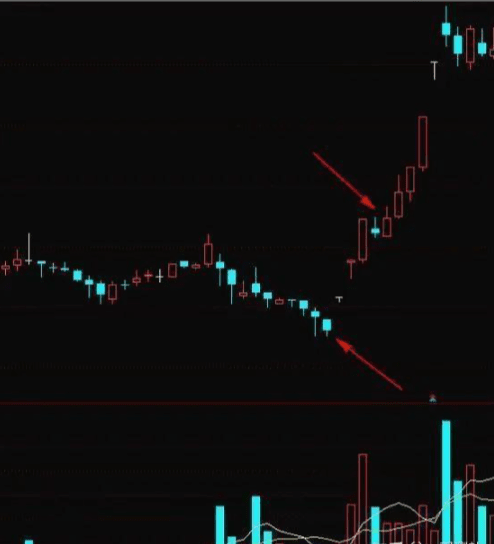
4: V-shaped reversal main upward wave: After the stock accumulates and pushes the price up, it forms a consolidation platform, while trading volume also cooperates vigorously. Then, in the final stage of the platform consolidation, the main force presses down the stock price, which begins to drop rapidly, and trading volume also shows a contraction phenomenon, creating a cushion.
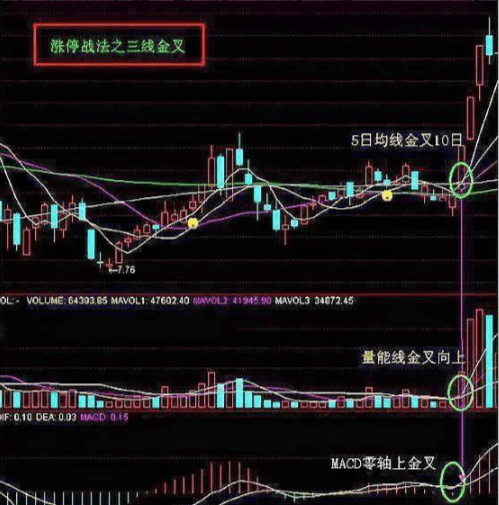
5. Three-line golden cross main upward wave: The three lines refer to moving averages, MACD, and volume lines. When the 5-day moving average forms a golden cross with the 10-day moving average, the volume line also crosses upwards, and MACD forms a golden cross above the zero line, it is time to buy the stocks, which will definitely rise significantly later.
I am A Xin, very pleased to meet everyone. A Xin focuses on making profits in ether contracts and spot, and the team still has positions available for quick entry to help you become a major player and a winner.

