
Valuing the real worth of a token can feel like a headache, but you can do it if you apply the right methodology.
First rule is don’t mix apples and oranges. There are many different types of tokens (L1, L2, protocols, L0, etc.), and each requires its own framework of analysis. Here we’ll only focus on L1 tokens, with two subcategories: general-purpose L1s and app-centric L1s.
General-purpose L1s: $ETH, $SOL, $AVAX, $BNB, $DOT, $ADA, $SUI
App-centric L1s: $HYPE, $dYdX, $OSMO, $RUNE, $RENDER, $TON, $RON
Revenue:
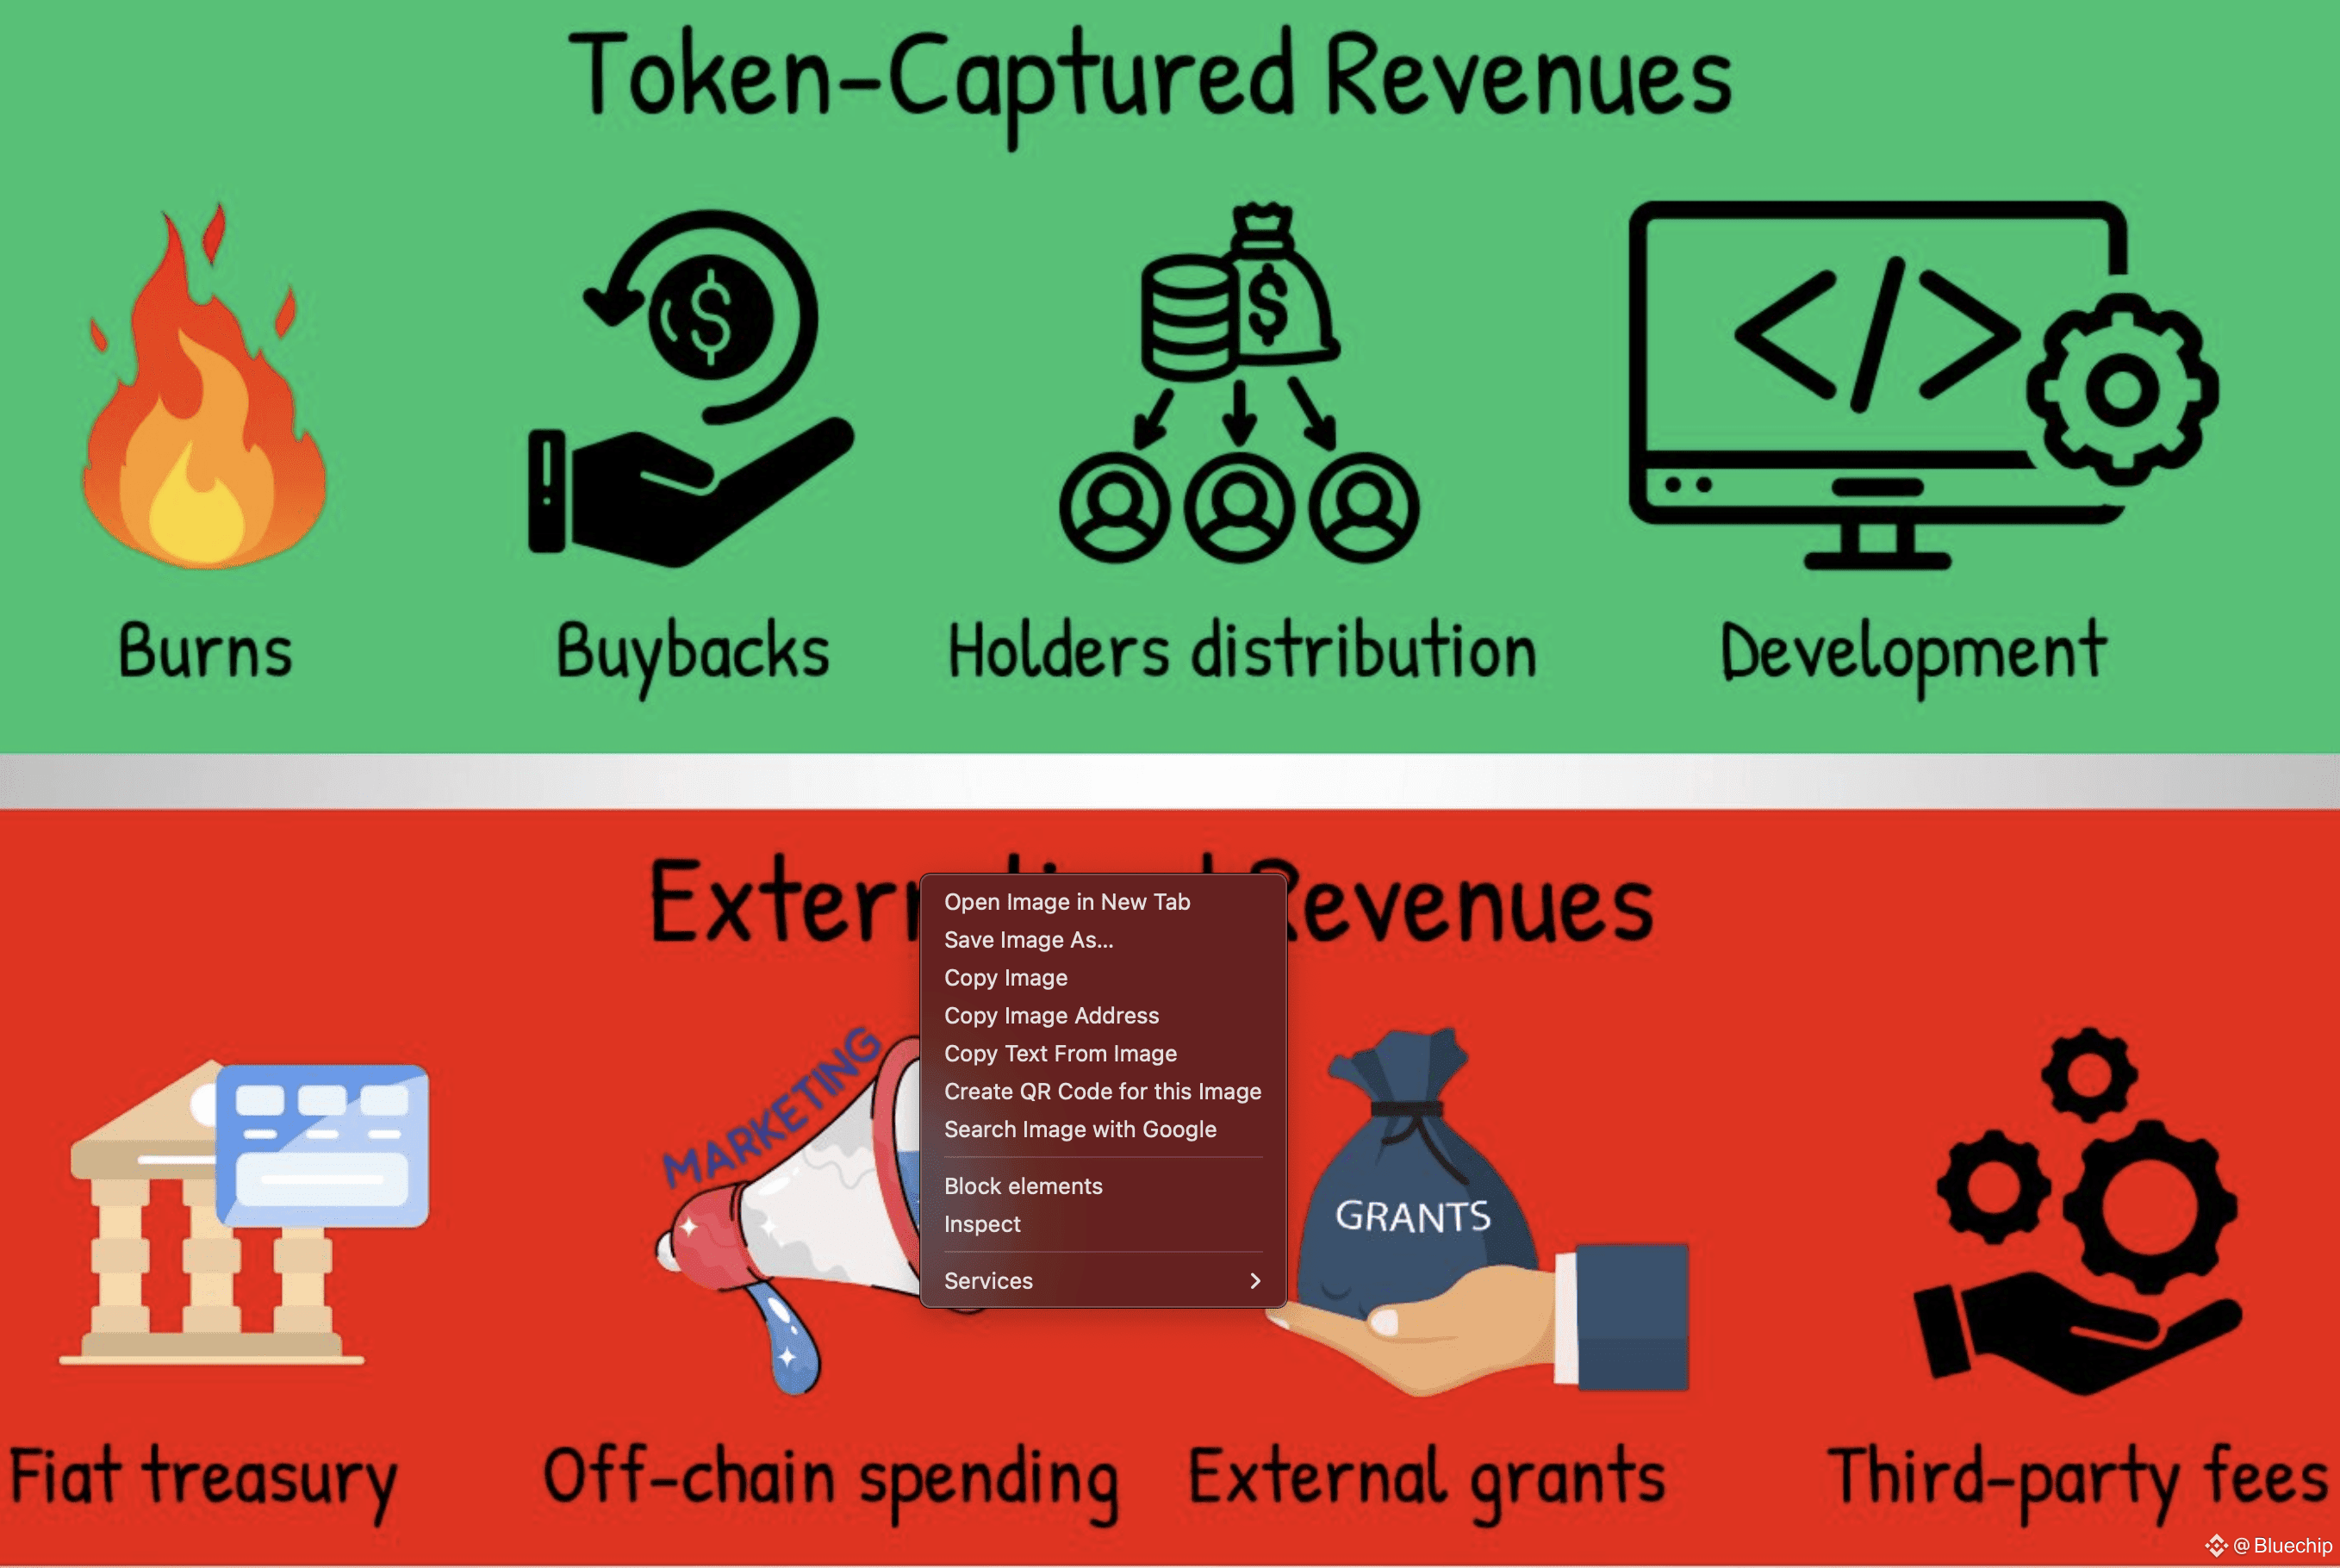
The first step is, of course, to look at revenue, but not just any revenue. What matters is the portion of revenue captured by the token. That can happen through buybacks, burns, redistribution to holders, or even revenue directed into protocol development.
What you shouldn’t include is revenue that leaves the L1 entirely and provides no benefit to token holders.
Once you’ve determined the portion of revenue that accrues to the token, you need to annualize it. If the protocol hasn’t been live for a full year, extrapolate, for example, take three months of revenue and multiply by four.
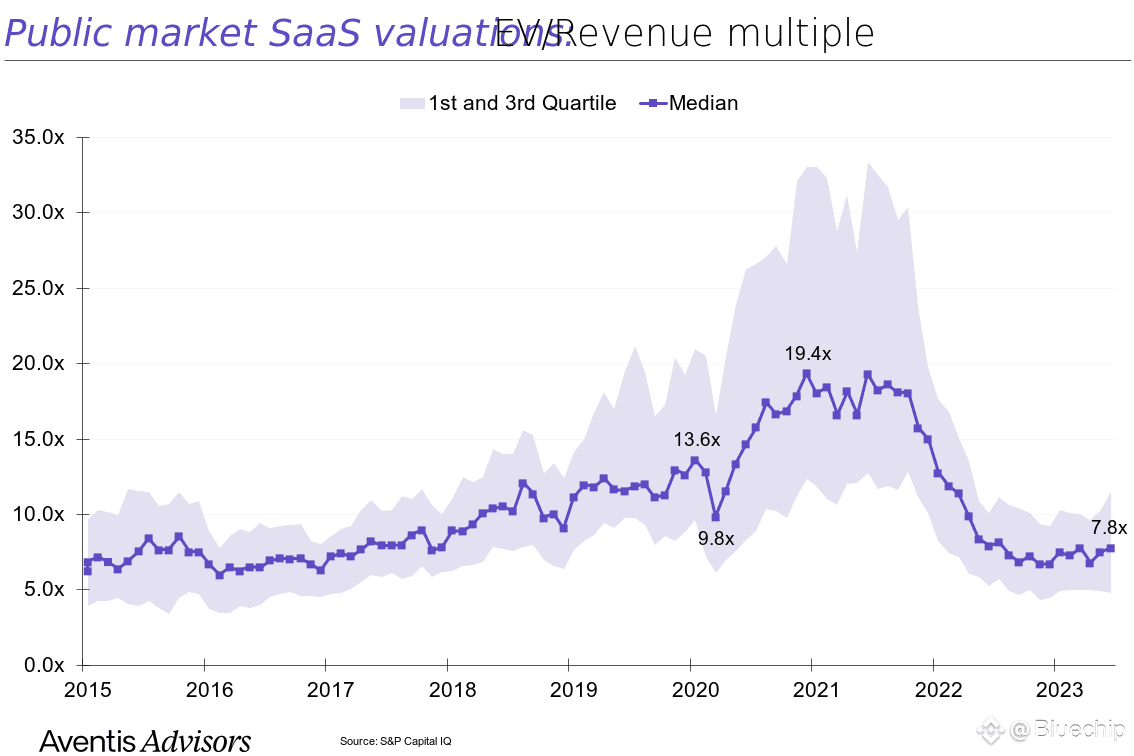
FDV/Revenue Ratio
The FDV/Revenue ratio gives a quick first impression of valuation. In traditional tech companies, this ratio usually falls between 8 and 15. Here again, make sure you’re using only the revenue that benefits the token.
Growth and Traction
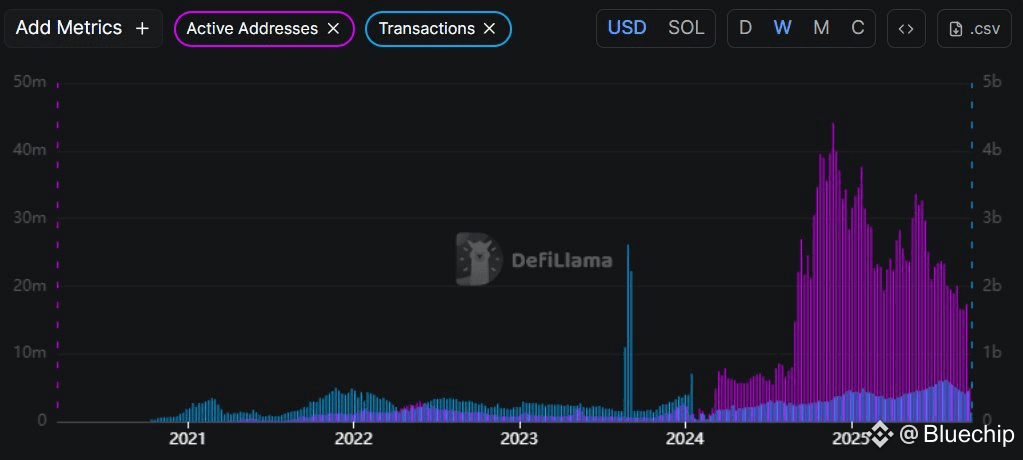
Even though the FDV/Revenue ratio is revealing, it isn’t enough on its own. For L1s, growth and traction play a huge role in valuation. You should analyze:
Active addresses
Trading volumes
Number of transactions
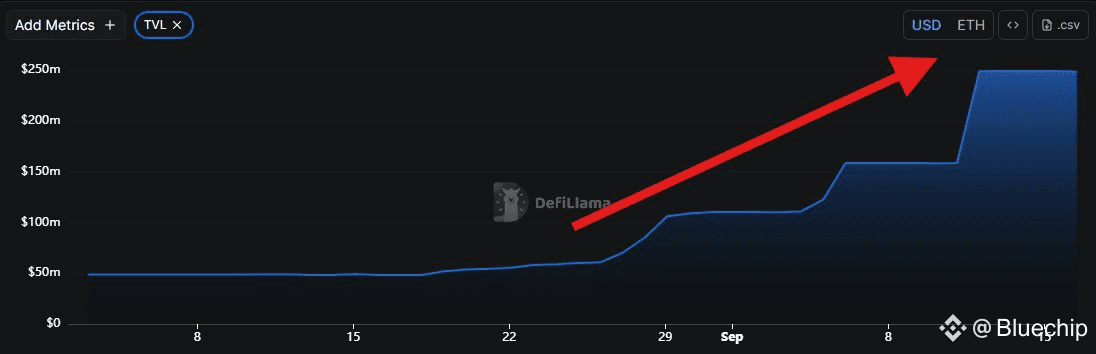
TVL
What matters most is the trendline rather than the absolute numbers. If usage metrics have been climbing consistently since launch, that usually has a favorable effect on valuation, even if the raw numbers aren’t massive yet. Investors are pricing in future volumes under the assumption that growth continues.
Security Budget
Every L1 has a security budget. Ideally, the network finances itself organically from fees. Otherwise, it relies on token inflation.
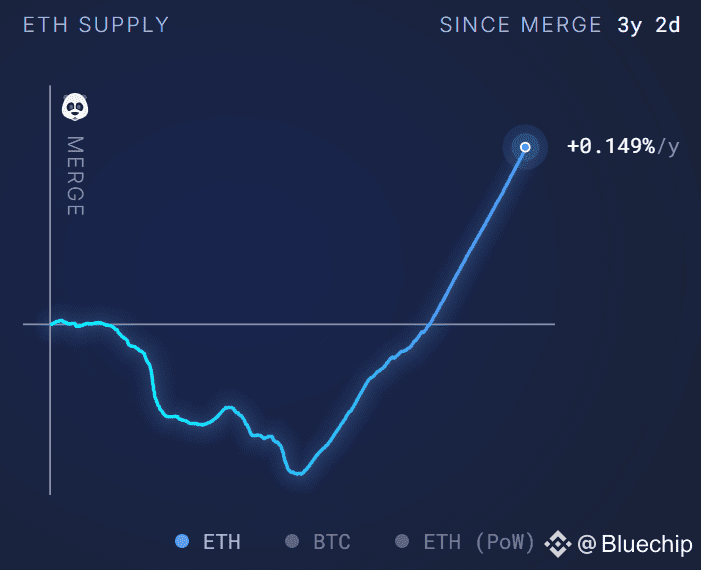
The key metric here is the Net Issuance Rate, calculated as: (issuance – burn)/supply
If this ratio is negative → excellent, more token is being burned than issued.
If positive → inflationary, not really good
Future Unlocks
Finally, you need to account for token unlocks. Two main questions:
When will the tokens unlock?
Who benefits?
Unlocks directed to marketing or team salaries = negative.
Unlocks used for development or redistributed to holders = positive.
If the unlocks don’t benefit token holders, you can use these benchmarks:
<10% of circulating supply = light
10–30% = moderate
30% = heavy
(You can also use tools like @Tokenomist_ai to track unlock schedules.)
Case Studies
$ETH
Over the past 365 days, Ethereum generated ≈ $740M in revenue. That may look small, but it’s largely due to EIP-4844, which significantly reduced gas fees (and therefore revenue).
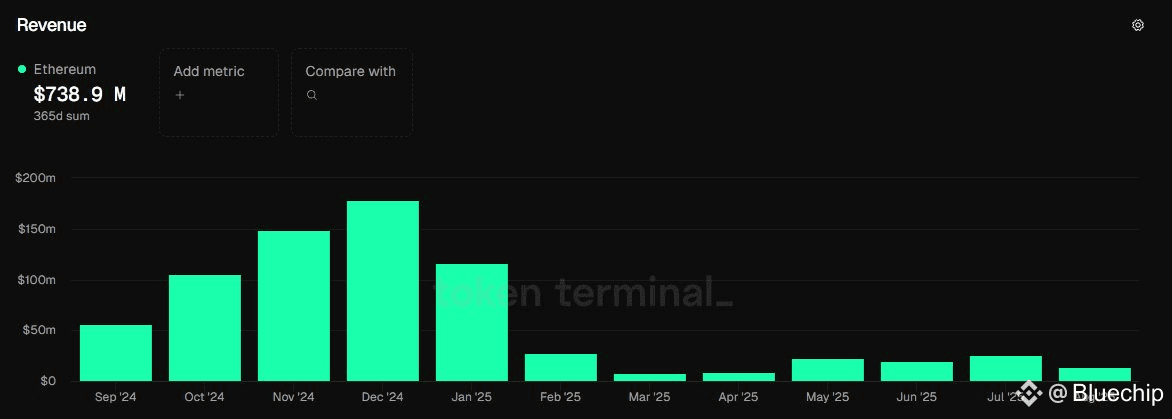
We can assume 100% of this revenue benefits ETH, through burning, staker payments, and MEV redistribution.
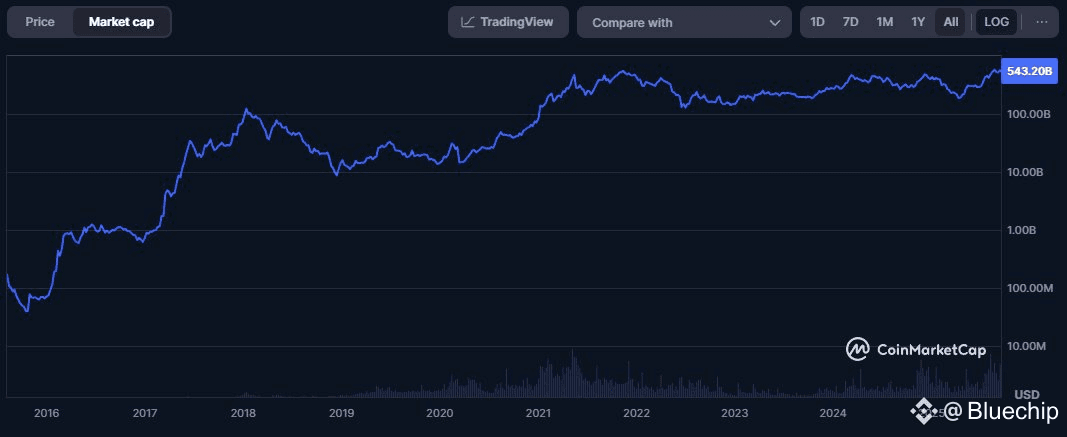
FDV/Revenue ratio ≈ 675 → astronomical compared to 8–15 in traditional tech.
But ETH shows why revenue alone isn’t the most important valuation metric.
Ethereum has a special status: it’s both a store of value and the global settlement layer. Its valuation includes a permanent structural premium.
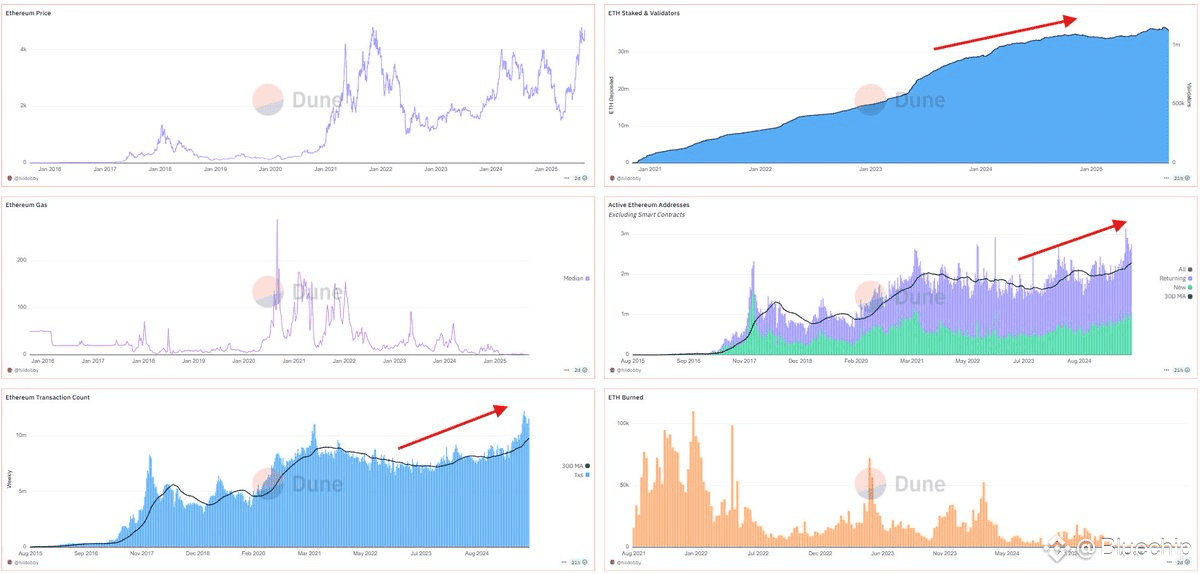
Issuance is only 0.5–0.7% of supply annually, but this is offset (and sometimes overcompensated) by the burn → ETH can even be deflationary.
Growth metrics are also excellent: more stakers, more active addresses, more transactions, more TVL. Ethereum is a success as a universal architecture.
Calling ETH over- or undervalued is difficult; other cases are easier.
$SOL
Over the past 365 days, Solana generated ≈ $387M in revenue, most of which accrues to token holders via burns and staking rewards.
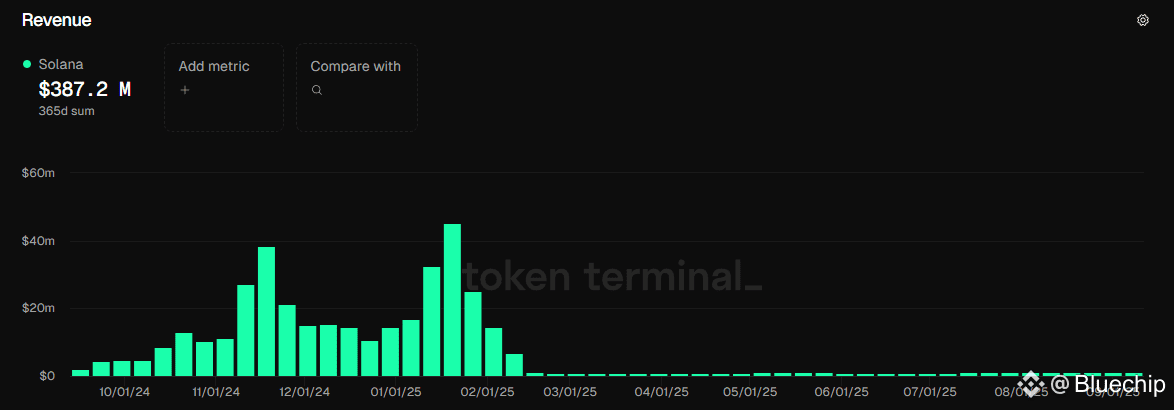
FDV = $143B → FDV/Revenue ≈ 370. Again, massive compared to traditional firms.
On growth, Solana’s active addresses and transaction counts show that the peak may already have passed, there’s less room for exponential growth.
Its valuation is justified mainly by its positioning as a high-throughput blockchain with potential for massive retail adoption.
$HYPE
Hyperliquid is unique in that it uses 100% of its revenue for token buybacks, so all revenue accrues directly to holders.
Last 90 days revenue: $255M → annualized ≈ $1B.
FDV = $52B → FDV/Revenue ≈ 52.
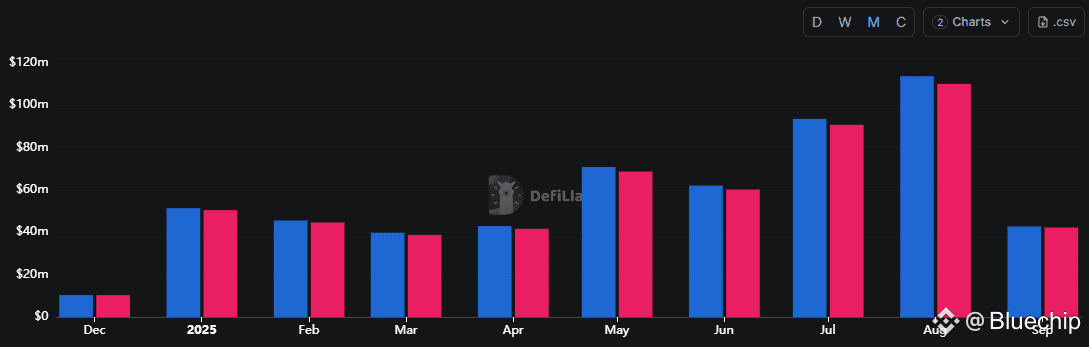
Still higher than traditional ratios, but far lower than ETH or SOL.
The current valuation is also supported by future growth potential:
Trading volume and user counts keep climbing month after month.
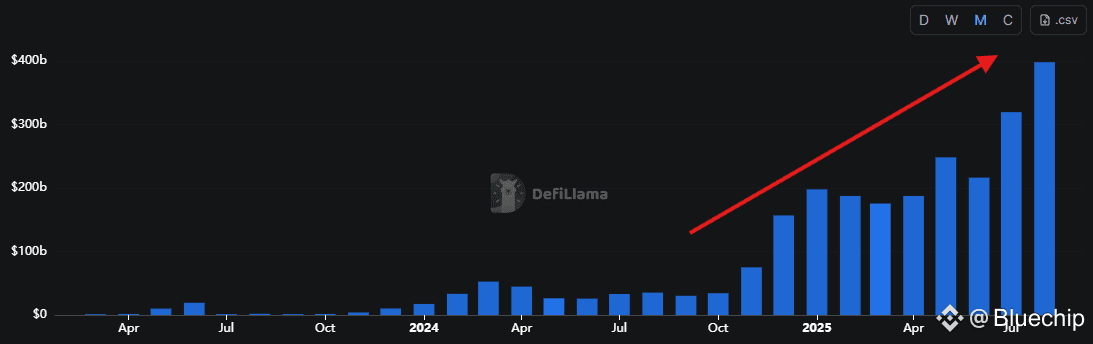
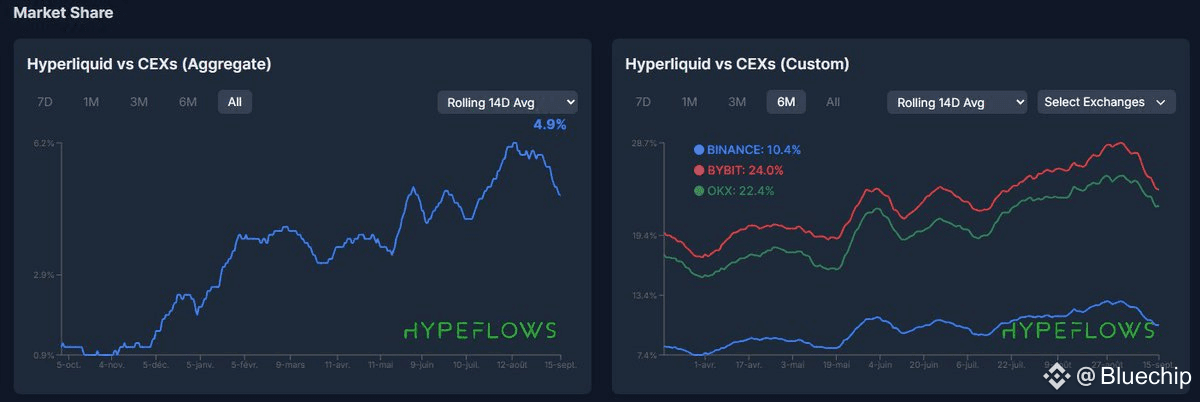
Hyperliquid only has ~4.9% of CEX market share. As it steadily eats into CEX dominance, upside remains huge.
Hyperliquid is a perfect example of how future growth expectations get priced in.
Conclusion
Valuing a Layer 1 token is never straightforward. It’s not just a matter of revenue, speculation, narratives, and expectations about the future often get priced in long before they materialize.
That being said, if we look strictly at the fundamentals, my view is that most L1 projects are overvalued compared to what they actually deliver today. The market continues to operate in a highly speculative mode, where growth and hype play as big a role, if not bigger, than real, current value capture.
In other words, revenue and fundamentals give us an anchor, but the real driver of prices in crypto remains speculation and future potential.
Always DYOR and size accordingly. NFA!
📌 Follow @Bluechip for unfiltered crypto intelligence, feel free to bookmark & share.