In the last issue, we explained the support and resistance lines; in this issue, we continue to explain the break low and rally pattern, the break high and pullback pattern, and the polarity conversion principle within support and resistance.
Break low and rally pattern and break high and pullback pattern
Most of the time, the market is not in a trending state but rather in a horizontal fluctuation range. In such cases, the market reaches a relatively harmonious state where bulls and bears coexist peacefully, sharing the spoils.
According to a research sample, approximately 70% of the time the market is in a non-trending state. Therefore, if any tool can provide profitable entry points in this environment, such a trading tool will be extremely practical. In fact, we have a set of effective technical tools for such market conditions. These are known as the 'break high and pullback' and 'break low and rally' patterns. When these two concepts are applied to candlestick charts, they become very useful. The break high and pullback pattern and the break low and rally pattern were initially developed based on Richard Wyckoff's related ideas, which he promoted in the early 20th century.
Trading activity is concentrated in a calm range. However, even in such a range, bears or bulls may sometimes be unwilling to be idle, attempting to break through the previous high or low levels. In these cases, trading opportunities arise. Specifically, if the market temporarily breaks above a resistance level or temporarily breaks below a support level, but is unable to maintain the gains (what is known as a 'false breakout'), then this situation provides us with an attractive trading opportunity. In such scenarios, the following price changes are likely to occur: the market will return from this boundary of the range to the opposite boundary.
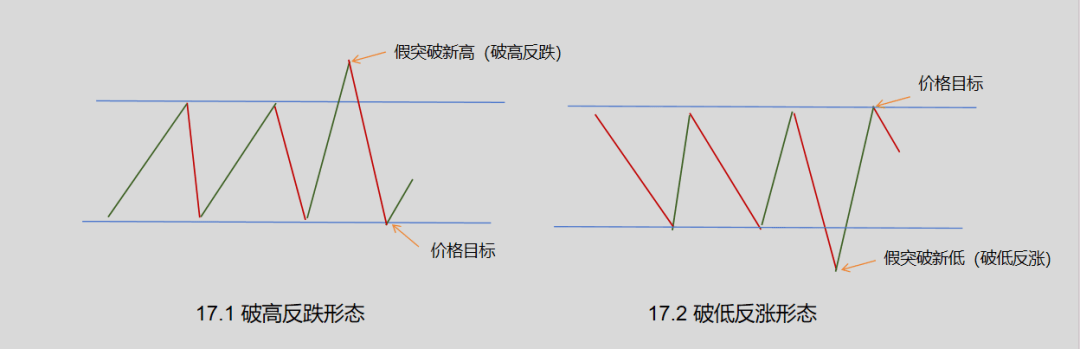
As shown in Figure 17.1, the market briefly broke through a resistance level but was unable to maintain this situation, causing prices to fall back below the previous highs, forming a 'false breakout'. In such cases, we should sell short. Additionally, the protective stop order should be placed above the current new high level. The price target is for the market to once again test the lower boundary of this range. Such false upward breakouts constitute what is known as a 'break high and fall back pattern'. If, during the formation of this break high and fall back pattern, some bearish candlestick chart indicators are also formed, it is indeed a great opportunity to sell short.
Conversely to the break high and fall back pattern is the break low and rise pattern. In the break low and rise pattern, prices initially broke below previous low levels. Later, prices rebounded, returning above the support zone that was previously broken (as shown in Figure 17.2). In other words, this new low level cannot be maintained. In this case, once prices push back above the previous low level, we should buy. Our price target is for the market to re-test the upper boundary of this range. The stop order level can be placed near the lowest point of the break low and rise pattern on that day. Trading using the break high and fall back pattern and the break low and rise pattern is completely feasible, as they provide both a clear price target (i.e., the other boundary of the sideways trading range) and a clear reference level for protective stop orders (i.e., the new high or new low level formed on the day of the 'false breakout').
Principle of Polarity Reversal
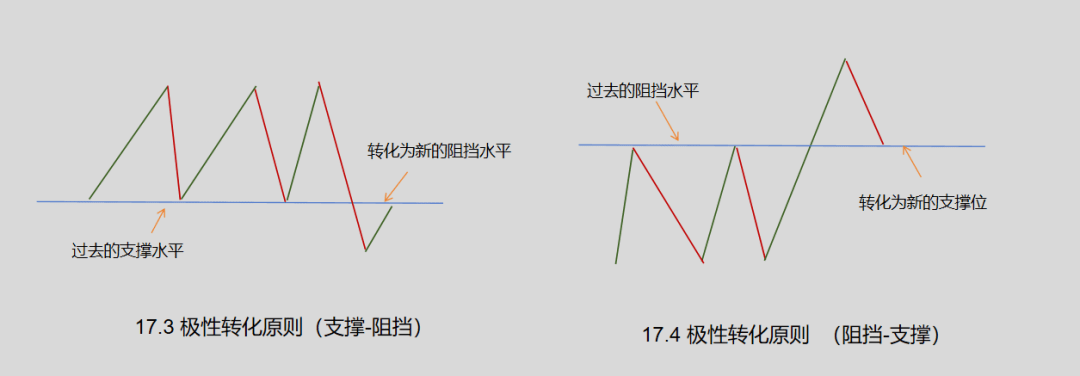
In the practice of candlestick chart analysis, support and resistance can be interchanged. This principle is both simple and sharp, effective—previous support levels evolve into new resistance levels; previous resistance levels evolve into new support levels. This is what I refer to as the 'Principle of Polarity Reversal'. Figure 17.3 illustrates the situation where support levels are converted into resistance levels. Figure 17.4 shows the case where past resistance levels are converted into new support levels.
The technical potential of this polarity reversal phenomenon is proportional to the following aspects:
1. The number of times the market has tested past support/resistance levels;
2. The size of trading volume and position size during each test.